Jump to content


Photo

emerging wave 3?


  • Please log in to reply
634 replies to this topic

#31 senorBS

senorBS

    Member

  • TT Member+
  • 10,940 posts

Posted 20 September 2017 - 05:43 PM

3 possible bear counts, C up from last Dec low ended with a slight failure at 25.58, or 25.58 was C of a large bearish developing contracting tri, and another count that 25.58 was "b" and we now need to decline below 20.89 in "c". As I stated earlier bull markets often start "ugly" and if bullish that really has to be the case here as the recent rally phase shows nothing clearly bullish IMO. Bottom line a friggin mess and I am not willing at this time to wager much at all either way.


Senor


#32 gannman

gannman

    Member

  • Traders-Talk User
  • 6,948 posts

Posted 20 September 2017 - 09:06 PM

what i think is happening is we are going to have one more thrust down into the equinox . key word being think ha ha we will see 


feeling mellow with the yellow metal


#33 senorBS

senorBS

    Member

  • TT Member+
  • 10,940 posts

Posted 21 September 2017 - 09:08 AM

exited my small remaining longs on the bounce, have no interest unless we regain 1300 for a few days


Senor


#34 dharma

dharma

    Member

  • Traders-Talk User
  • 9,612 posts

Posted 21 September 2017 - 10:33 AM

jim rogers "When we have the bear market, a lot of people are going to find that, ‘Oh my God, I own an ETF, and they collapsed. It went down more than anything else.’ And the reason it will go down more than anything else is because that’s what everybody owns."

nothing happened yesterday, in terms of gld tonnage.  i keep in mind that the banksters run the gld and they report adds and subractions sometimes in bankster time. now , it may be that what we are seeing is fund allocation of gld , in which case it will not be subtracted on declines. it remains to be seen

i tend to agree w/gannman and here is why- in the hourly charts gld/slv/gdx/gdxj are all showing hourly divergences i use a wilder 9bar rsi, and have for decades.  whipsaws do occur so as is the case w/every tool , there are whipsaws.  right now , however w/tomorrow being the equinox  i am leaning towards the divergences will hold lets see what tomorrow brings

i am in nibble mode.   in november when trump won the election , on the night of the election gold soared until modi called in the 50/100rps note. then gold and the stock market both changed directions . that high was just tested in the gold market.  the banksters sold against it and here we are.  as i said yesterday holding 1285 is a sign of strength if not the .618 correction comes into play=1267.3    i dont think we get there, but i dont care what i think i have to follow my parameters . so my plan is to nibble today and see where we are tomorrow . if the divergences hold then i am more aggressive

dharma


#35 dharma

dharma

    Member

  • Traders-Talk User
  • 9,612 posts

Posted 21 September 2017 - 10:50 AM

i tried to edit this  it would not let me so here it is again

nothing really happened yesterday in terms of gld tonnage, the banksters run the gld and they report gains or losses in tonnage in bankster time. now it may be that fund allocation of gld is solid and the funds bought and held their allocation. we will see

my original post had heavy black lines and was not readable . so i am trying to remember what i wrote. i agree w/gannman today or tomorrow , the equinox will see the low. so i am in nibble mode here today , and will become more aggressive tomorrow should the hourly divergences in gld/slv/gdx/gdxj hold. i use a 9 bar wilder rsi, and have so for decades . whipsaws do occur a small %of the time like every tool , used by itself it is not infallible   in fact i just got filled on some buys while writing this piece

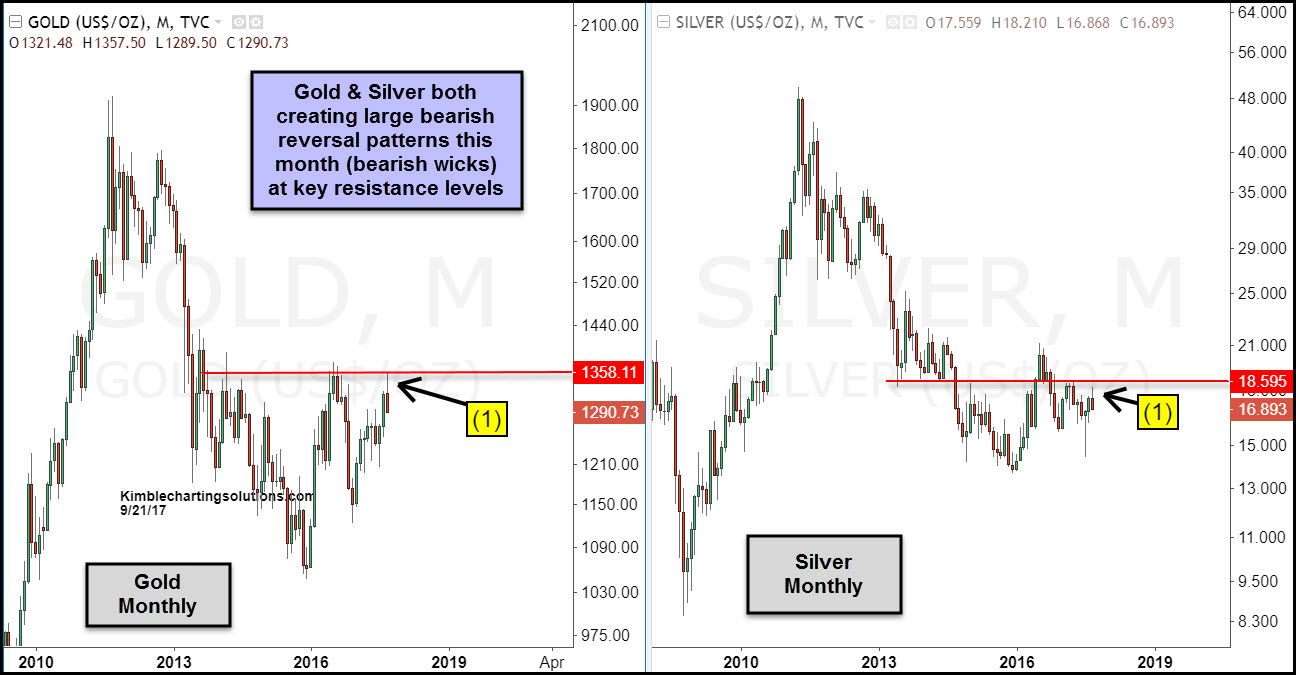
in november on the eve of election gold was soaring. then modi reversed those gains , calling in the 50/100rps note. the banksters just sold those highs that matched the november highs.  and here we are 50% correction is 1285 . holding that imo is a sign of strength .if not we go to the .618 correction 1267.3   i dont think we get there,but i dont care what i think . i follow my indicators and go from there.  i feel we are on the precipice of a breakout in the sector

lets see what tomorrow brings

dharma


jim rogers-“When we have the bear market, a lot of people are going to find that, ‘Oh my God, I own an ETF, and they collapsed. It went down more than anything else.’ And the reason it will go down more than anything else is because that’s what everybody owns,” he says.


#36 Smithy

Smithy

    Member

  • Traders-Talk User
  • 2,285 posts

Posted 21 September 2017 - 10:56 AM

Thanks Dharma, you are well informed.


#37 dougie

dougie

    Member

  • Traders-Talk User
  • 9,040 posts

Posted 21 September 2017 - 12:43 PM


3 possible bear counts, C up from last Dec low ended with a slight failure at 25.58, or 25.58 was C of a large bearish developing contracting tri, and another count that 25.58 was "b" and we now need to decline below 20.89 in "c". As I stated earlier bull markets often start "ugly" and if bullish that really has to be the case here as the recent rally phase shows nothing clearly bullish IMO. Bottom line a friggin mess and I am not willing at this time to wager much at all either way.


Senor


thanks. those are my counts too. fail here and we might tumble a ways. Maybe a long ways. 


#38 dougie

dougie

    Member

  • Traders-Talk User
  • 9,040 posts

Posted 21 September 2017 - 12:47 PM

action at the 10 minute chart not bearish IMO.


#39 dougie

dougie

    Member

  • Traders-Talk User
  • 9,040 posts

Posted 21 September 2017 - 12:58 PM

lets see 23.60


#40 jabat

jabat

    Member

  • Traders-Talk User
  • 604 posts

Posted 21 September 2017 - 01:32 PM

gold-silver-monthly-bearish-reversal-pat