a couple of charts from investing.com forum contributors....
Edited by Russ, 16 December 2017 - 02:47 PM.

Member

Posted 16 December 2017 - 02:45 PM
a couple of charts from investing.com forum contributors....
Edited by Russ, 16 December 2017 - 02:47 PM.
Member

Posted 16 December 2017 - 04:26 PM
for da bears.... clearly 5 waves down since sept. high, and the formation of a bull flag with cci and bollinger bands looking ready to move up, also important is the blue line on the bottom of the price chart of the xau, that line was the low back in 2000, these metal stocks are extremely unlikely to go and take those levels out, the all time lows going back decades.
that "5 down from Sep" is very likely v of c of a wave 2, correcting Dec 2016-Feb 2017 5 up wave 1 rally, so that works for me...
Senor
Member

Posted 16 December 2017 - 06:45 PM
for da bears.... clearly 5 waves down since sept. high, and the formation of a bull flag with cci and bollinger bands looking ready to move up, also important is the blue line on the bottom of the price chart of the xau, that line was the low back in 2000, these metal stocks are extremely unlikely to go and take those levels out, the all time lows going back decades.
that "5 down from Sep" is very likely v of c of a wave 2, correcting Dec 2016-Feb 2017 5 up wave 1 rally, so that works for me...
Senor
Yep that seems to me a favored count. Will know if we blast off monday
Member

Posted 16 December 2017 - 07:42 PM
basically i think we completed the C wave of a multi month abc correction on dec 12 2017
meaning we have been correcting for months . if correct we should be straight up with very
little pullback. looking at some charts you have a clear 5 waves down from sep 7 into dec 12
again gdx above 24 fis a trigger for me we are sitting at 22 and i want to see a close above 24
just my take if this count is correct then we will have years ahead of us of bull action
Member
Posted 17 December 2017 - 10:46 AM
for da bears.... clearly 5 waves down since sept. high, and the formation of a bull flag with cci and bollinger bands looking ready to move up, also important is the blue line on the bottom of the price chart of the xau, that line was the low back in 2000, these metal stocks are extremely unlikely to go and take those levels out, the all time lows going back decades.
that "5 down from Sep" is very likely v of c of a wave 2, correcting Dec 2016-Feb 2017 5 up wave 1 rally, so that works for me...
Senor
Didn't the up wave 1 start in Jan 2016?
Member

Posted 17 December 2017 - 11:11 AM
XAU bottomed Jan 19th 2016, the 36 year anniversary of the 1980 top.
Member
Posted 17 December 2017 - 11:28 AM
for da bears.... clearly 5 waves down since sept. high, and the formation of a bull flag with cci and bollinger bands looking ready to move up, also important is the blue line on the bottom of the price chart of the xau, that line was the low back in 2000, these metal stocks are extremely unlikely to go and take those levels out, the all time lows going back decades.
that "5 down from Sep" is very likely v of c of a wave 2, correcting Dec 2016-Feb 2017 5 up wave 1 rally, so that works for me...
Senor
Didn't the up wave 1 start in Jan 2016?
That is the LARGER DEGREE PRIMARY wave 1 if you will in HUI and XAU from Jan to July 2016. We are talking a smaller degree wave "i" from Dec 2016 bottom to Feb 2017 high, so that gives us a "potential" 1-2, i-ii with a big 3rd dead ahead IF this is the correct count.
Senor
Member
Posted 17 December 2017 - 12:28 PM
for da bears.... clearly 5 waves down since sept. high, and the formation of a bull flag with cci and bollinger bands looking ready to move up, also important is the blue line on the bottom of the price chart of the xau, that line was the low back in 2000, these metal stocks are extremely unlikely to go and take those levels out, the all time lows going back decades.
that "5 down from Sep" is very likely v of c of a wave 2, correcting Dec 2016-Feb 2017 5 up wave 1 rally, so that works for me...
Senor
Didn't the up wave 1 start in Jan 2016?
That is the LARGER DEGREE PRIMARY wave 1 if you will in HUI and XAU from Jan to July 2016. We are talking a smaller degree wave "i" from Dec 2016 bottom to Feb 2017 high, so that gives us a "potential" 1-2, i-ii with a big 3rd dead ahead IF this is the correct count.
Senor
Gotcha.
Member
Posted 17 December 2017 - 12:30 PM
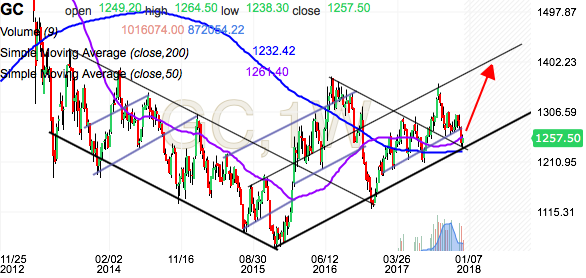
Fun with lines, the recent pullback could be interpreted as a test of the breakout through the downtrendline from 2011....
Edited by Russ, 17 December 2017 - 12:38 PM.


