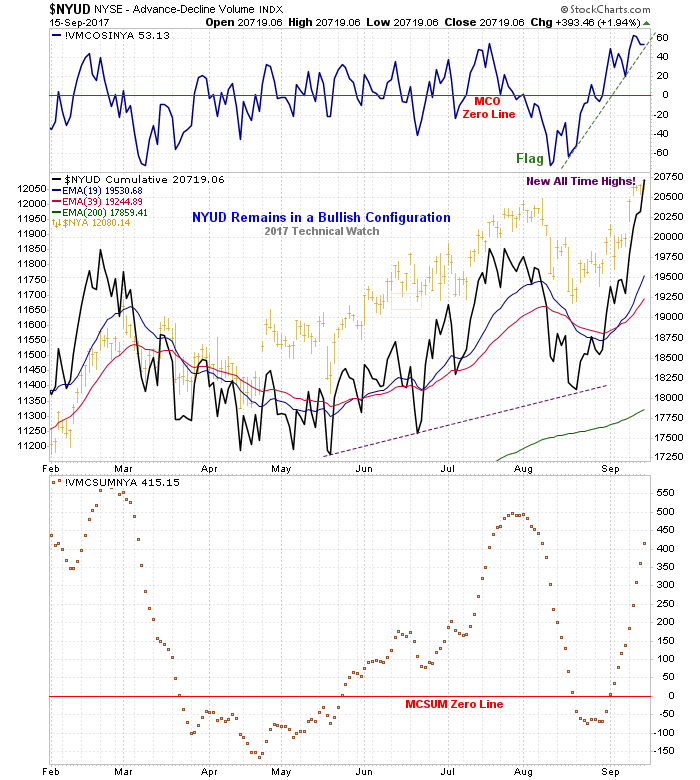
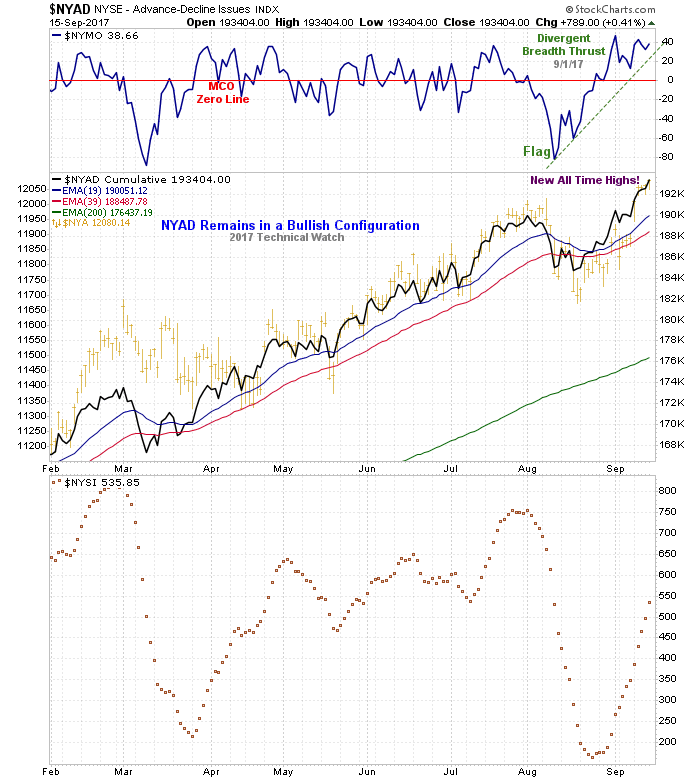
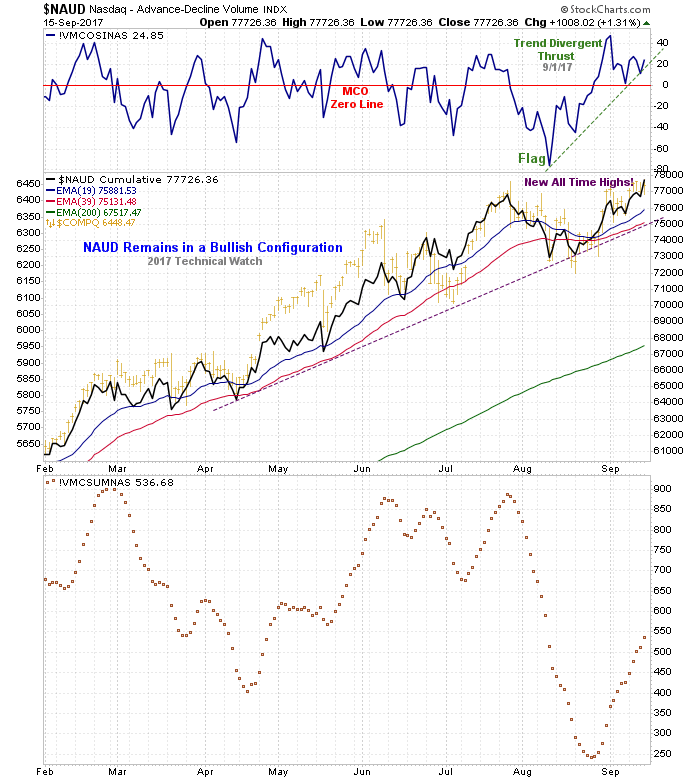
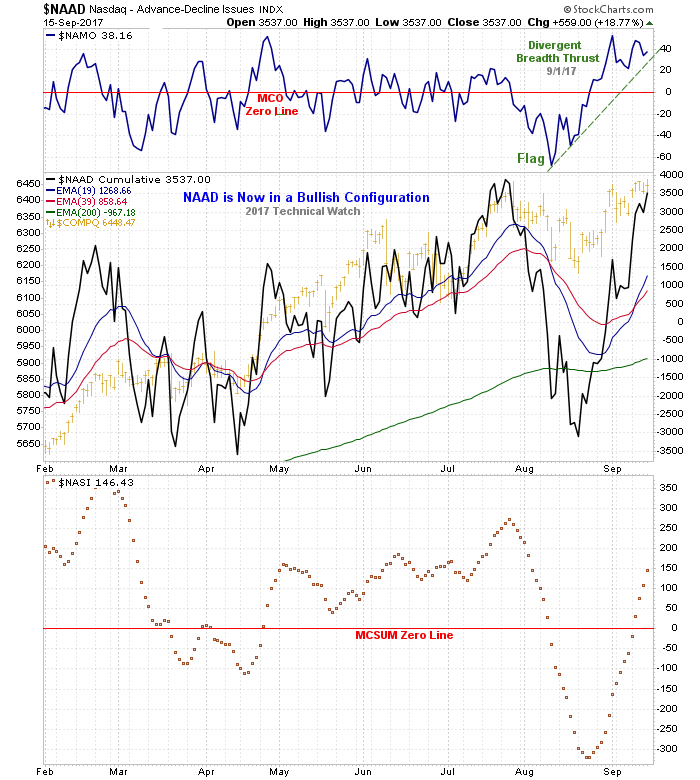
"3rd waves are ''wonders to behold'' and for many good reasons. Technically, this is the time where most analysts throw in the towel as price is now confirming what the internals told the analyst during wave 1 which was a change in direction was probable. This is also the time in which extremes in many indicators will show up - something in which I refer to as ''flags'' - which are later used in approximating the termination point of the entire 5 wave pattern sequence structure. In equities, these extremes will be measured in the raw data of both (cumulative) breadth and volume - and the strength or weakness of the indicators that use such information - as well as their relationship to each other. Price pattern wise, one will always be able to identify a third wave because of the fact that price patterns will break out of basic support or resistance areas that were previously controlling the price pattern up until that time. Psychologically, this is when the mind set is that we remember how we all got burned before and that in no way is this the start of a major move higher - also known as climbing the ''wall of worry''. Once the market gets high enough, people start throwing in the towel on their bearish mind set, and this continues to a point when all of the ''willing'' buyers are in the market. 3rd waves are also never the shortest wave in a 5 wave structure, and more times than not, are generally the longest wave in either price, percentage gain, or both, to what will eventually be the larger 5 wave pattern structure sequence overall."
Primer on Elliott Wave analysis: http://tinyurl.com/zpeshcy
I have studied the internal waves of the market ever since 1983 as well as RN Elliott's original works. No Way was Wave 4 ended in 2016 or Wave 3 still in existence according to detailed internal wave structures.

A Microscopic Look at the Elliott Wave and the S&P 500
#11

-
- Traders-Talk User
- 6,186 posts
blustar
Posted 18 September 2017 - 01:22 PM
#12
-

- Traders-Talk User
- 10,960 posts
Member
Posted 18 September 2017 - 01:41 PM
The SPX is making quite another of those strange and long 'bull 'flags' today. Today is TD 28 from the last top. A perfect 6 week (Hurst 6 week- Gann 32 -2) would suggest Wednesday this week for the top. The last 55 TD turn (due Sept 20) came on July 3rd then dropped for two days. Hadik is looking for a low this week between the 18th-22nd. The rising wedge fits perfectly between 2517 Wed and 2464 Friday
The indicators are suggesting higher prices over the next few days. It is quite common to rally into the FOMC announcement. If it does this (which it looks like), we may see prices as high as 2517/18 before the top comes in.
I'm waiting to bail out of shorts and go long later today after this pull back. UVXY is down over 7%. SVXY is up higher than I expected.
I strongly disagree with Wave 3 being past Nov 2014 because I have done the microscopic work I have done ever since the 5 wave bulls from the 1980's and nowhere can it be shown internally that we are still in wave 3 of 5. The only thing it can be is a strong running correcting in the wave 4 position.
expanding triangles...look them up....they are continuation patterns......bob prechter used these same words in the 90.s when he poo pood any thought of the epicenter of primary wave three up......and since primary wave 3 up hasnt happened yet then it indeed lays before us .....and bob is a mensa...lol >existence according to detailed internal wave structures.<......and of course those who try to convince themselves they are ewave expurtz for some reason allways allude to an alternate count.........lol ...there is no alternate count there is only one count .....THE RIGHT ONE .....DENNNY CRANE
and btw ....>nowhere can it be shown internally that we are still in wave 3 of 5<.......wrong look at the cumulative weekly ad line of the nyse....it topped in 1997 came down in 3 distinct waves and bottomed in march 2000 and has been melting up in a giant 3rd wave ever since ....primary wave 5 comes after primary wave 3 up.....wartch the sky
#13
-
- Traders-Talk User
- 10,960 posts
Member
Posted 18 September 2017 - 01:44 PM
>The SPX is making quite another of those strange and long 'bull 'flags' today.<....,.yull figure it out with 20 20 hindsite
#14
-

- Traders-Talk User
- 7,433 posts
Member
Posted 19 September 2017 - 01:31 AM
>Wave 3 of Cycle Wave 5 ended late in 2014< wrong wrong wrong .....the epicenter of primary wave 3 up is under way off the 2nd wave that ended in 2009.....so it is written and so it shall be
it seems the epicenter of primary wave three up....is like a deity......it was, it is.....and it will ever be
dominus vo biscum
luckily maybe you know the stock market a little better than you know latin.......
vo biscum means nothing.........vobiscum instead means ''with you''
forever and only a V-E-N-E-T-K-E-N - langbard
#15
-
- Traders-Talk User
- 10,960 posts
Member
Posted 19 September 2017 - 06:08 AM
>Wave 3 of Cycle Wave 5 ended late in 2014< wrong wrong wrong .....the epicenter of primary wave 3 up is under way off the 2nd wave that ended in 2009.....so it is written and so it shall be
it seems the epicenter of primary wave three up....is like a deity......it was, it is.....and it will ever be
dominus vo biscum
luckily maybe you know the stock market a little better than you know latin.......
vo biscum means nothing.........vobiscum instead means ''with you''
one things for sure.....you at least know latin
#16
-
- Traders-Talk User
- 7,433 posts
Member
Posted 19 September 2017 - 11:47 AM
>Wave 3 of Cycle Wave 5 ended late in 2014< wrong wrong wrong .....the epicenter of primary wave 3 up is under way off the 2nd wave that ended in 2009.....so it is written and so it shall be
it seems the epicenter of primary wave three up....is like a deity......it was, it is.....and it will ever be
dominus vo biscum
luckily maybe you know the stock market a little better than you know latin.......
vo biscum means nothing.........vobiscum instead means ''with you''
one things for sure.....you at least know latin
and you for sure don' t know that either.......
Edited by andr99, 19 September 2017 - 11:52 AM.
forever and only a V-E-N-E-T-K-E-N - langbard
#17
-
- Traders-Talk User
- 6,186 posts
blustar
Posted 19 September 2017 - 12:57 PM
All other info aside, I have counted the microscopic waves since 1983 and do not see five wave advances past late Nov 2014, it is that simple. We are in a powerful Primary 4th wave running correction of Cycle Wave 5 since 2009. The 3rd wave advance ran from late 1974 to 2000 and Wave 1 from 1942 to 1966. Now there is a possibility that 1942 to 2020 will end up being large 3rd wave itself, but is a 5 wave advance soon to come to a major halt with major dire consequences.
#18
-
- Traders-Talk User
- 6,186 posts
blustar
Posted 19 September 2017 - 12:58 PM
Looking for a top near SPX 2514/15 on the 20th. Looking for 2461/62 by Friday.
#19
-

- Traders-Talk User
- 10,787 posts
Member
Posted 19 September 2017 - 01:20 PM
Anybody got a count back to March 8, 1817 when the NYSE began ?
#20
-

- Traders-Talk User
- 12,524 posts
Member
Posted 20 September 2017 - 07:45 AM
Anybody got a count back to March 8, 1817 when the NYSE began ?
0 lol!!


Also tagged with one or more of these keywords: SPX
TTHQ Directory →
Fearless Forecasters →
Slight Correction at Hand?Started by blustar , 08 Mar 2024 |
|
|
||
TTHQ Directory →
Fearless Forecasters →
More Reasons Than One to Believe that March 20th Will Be THE TopStarted by blustar , 19 Feb 2024 |
|

|
||
TTHQ Directory →
Fearless Forecasters →
SPX -- 2024Started by iloli way , 18 Feb 2024 |
|

|
||
TTHQ Directory →
Fearless Forecasters →
4 Year Cycle AdjustmentStarted by blustar , 01 Feb 2024 |
|
|
||
TTHQ Directory →
Fearless Forecasters →
Higher Prices Expected into Next WeekStarted by blustar , 19 Jan 2024 |
|
|

