Jump to content


Photo

Elevated Risk of Turn on Monday and Tuesday


  • Please log in to reply
14 replies to this topic

#1 Douglas

Douglas

    Member

  • Traders-Talk User
  • 1,832 posts

Posted 24 March 2018 - 12:55 PM

The next  risk windows identified by my trading system for a stock market turn or acceleration of the current down trend are Monday the 26th of March and Tuesday the 27th of March.  Unusually for consecutive days, these are two distinctly different types of risk windows, so a whipsaw is likely.  


This coming week's turn risk window or at the latest the next risk window after that on April 2nd should clarify if this down move is a grizzly  or just a teddy bear.  Given the apparent exhaustion of all the recent speculative fever, it seems more likely the former, but as I've repeatedly noted my cracked crystal ball is best used as a paper weight. 


Regards,

Douglas 


#2 OEXCHAOS

OEXCHAOS

    Mark S. Young

  • Admin
  • 22,020 posts

Posted 24 March 2018 - 03:32 PM

We should bottom here very shortly. I would expect wild volatility (Multi-swing action) to mark the low.


Mark


Mark S Young
Wall Street Sentiment
Get a free trial here:
http://wallstreetsen...t.com/trial.htm
You can now follow me on twitter


#3 chem

chem

    Member

  • Traders-Talk User
  • 187 posts

Posted 24 March 2018 - 06:32 PM

good spot for at least a bounce with price just above the 200 day sma and 0.618 of the initial jan/feb correction. Quite a bit of down side momentum over the last two days maybe a tough nut to sustain a turn from here.


Chem


#4 dougie

dougie

    Member

  • Traders-Talk User
  • 9,047 posts

Posted 24 March 2018 - 06:56 PM

We should bottom here very shortly. I would expect wild volatility (Multi-swing action) to mark the low.


Mark

no significant positive divergences yet are there?


#5 cycletimer

cycletimer

    Member

  • Traders-Talk User
  • 2,623 posts

Posted 24 March 2018 - 09:12 PM

We should bottom here very shortly. I would expect wild volatility (Multi-swing action) to mark the low.
 
Mark


I concur Mark

#6 Geomean

Geomean

    Member

  • Traders-Talk User
  • 1,177 posts

Posted 25 March 2018 - 01:39 AM

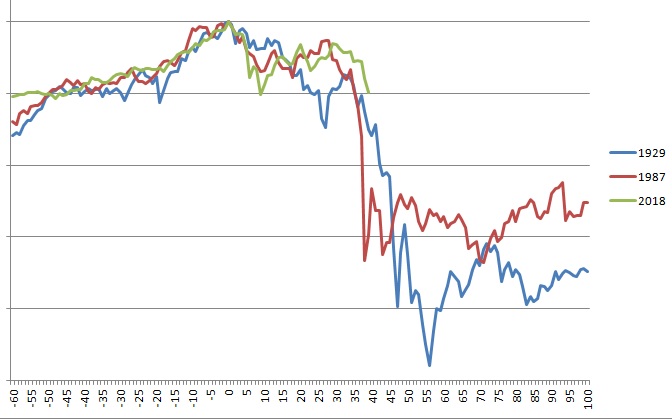
Both the 1929 and 1987 crashes had Wave iii lows on the third Tuesday after their wave 2 tops. Then two days of violent retracements before continuing downward. Tuesday, March 27th is the third Tuesday following the March 12-13, 2018 Wave 2 highs.

Edited by Geomean, 25 March 2018 - 01:45 AM.

Opportunity knocks on your door every day-answer it.

#7 bigbud

bigbud

    Member

  • Traders-Talk User
  • 536 posts

Posted 25 March 2018 - 02:59 AM

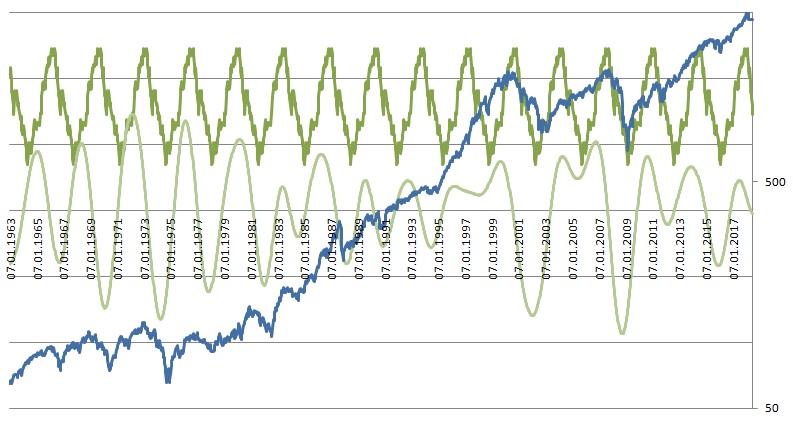
this cycle is likely to have topped out. Will generally be a seller until summer 2019 +/- 6 months


20180325a.jpg


not looking for a crash, but am watching how this unfolds the next 1-2 weeks...

20180325b.jpg


Edited by bigbud, 25 March 2018 - 03:03 AM.


#8 bigbud

bigbud

    Member

  • Traders-Talk User
  • 536 posts

Posted 25 March 2018 - 03:20 AM

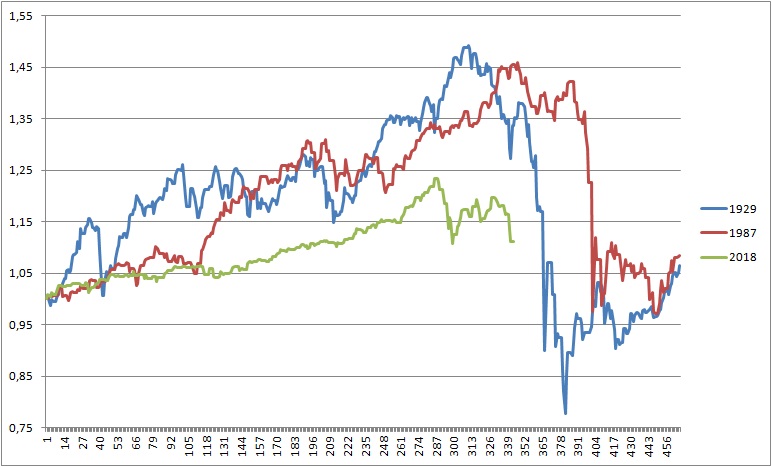
this is alligned with the crash-cycle. A bit early now, but within the relevant window

20180325c.jpg


#9 Douglas

Douglas

    Member

  • Traders-Talk User
  • 1,832 posts

Posted 25 March 2018 - 03:33 AM

Dougie, I show the following stock market positive indicators and divergences on Friday March 23: extreme closing tick, extreme put option buying, extreme TRIN, on-balance volume divergence, new lows divergence, A-D divergence, up volume - down volume divergence and an advance decline line divergence.  That being said, I had almost all of these divergences on Thursday too, and the market still went down on Friday.  As indicators, they appear to work a bit like old hand brakes on a bike that take a while to grab and stop you.  


Geomean, as to a crash next week, I guess it's possible, but that falling feeling I had back on Friday the 16th of October 1987 just wasn't there this past Friday.  Maybe I'm just a lot older and more jaded, who knows.  I still remember Friday the 16th of October 1987 like it was yesterday.  I was trading OEX options back then using Elliott Wave and other technical analysis. After the price action that Friday, I knew the market would crash on Monday.  That Friday night I was literally scared to death we were about to experience a 1930's style collapse. 


The FED market put was born that Monday the 19th of October 1987.  Rather than let the market punish the portfolio insurance stupidity that caused the crash, Alan Greenspan flooded the banking system with money preventing a contraction which could have gotten out of hand, but would have instilled some market discipline.  Central bankers have all always worried more about Wall Street than Main Street by printing money to drive creeping inflation which in the long term impoverishes salaried workers but helps drive asset prices higher.  Alan Greenspan just took it to a new level   It will be interesting to see if Chairman Powell is cut from the same cloth.  Maybe you are right and  the market will test him soon just to be sure he's on their team.


Regards,

Douglas


#10 Geomean

Geomean

    Member

  • Traders-Talk User
  • 1,177 posts

Posted 25 March 2018 - 12:37 PM

Douglas, I respect what you are saying. I was in an investment group meeting on 10/19/87 of non technical amateur macro types and we all said we were completely confident it was a blip, albeit a large one and bought more. We felt the Fed was ready and able and the crash then was mainly a market phenomena and associated with the rate tightening and portfolio insurance. Now, after 8 years of quantitative easing followed by a 3 year massive increase in market liquidity via lending out of Fed assets through various forms of hypothecation, (for further re-hypothecation) and fiscal stimulus, only one in the investment group expresses confidence in the Fed,s ability to hold asset prices at these levels or avoid the consequences of an overwhelming world wide daisy chain of derivatives and counter-party risks. Im not saying a crash will happen, but since we already have breakdowns Friday in INDU and NYA below the Feb lows, the Hurst models almost uniformly are labeling Jan 2018 as at least an 18 month high, (and generally much greater) and either the wave iii of © of IV or wave iii of (3) of 1 of (a) alternate Elliott counts are looking for a 5 Wave impulse down here, the breakdown will continue and the only question is its degree. A 20%+ crash would lay bare the obvious that these asset price levels are due to and quickly make a mockery of the last 8 years off manipulation. A correction down to Wave 4 of lesser degree would leave open the possibility of higher highs ahead. I have no confidence in either call except where they align, but we should learn the actual answer fairly quickly.

Edited by Geomean, 25 March 2018 - 12:41 PM.

Opportunity knocks on your door every day-answer it.