Jump to content


Photo

The April 18-19 Time and Cycle Cluster swing High


  • Please log in to reply
7 replies to this topic

#1 Rocketman

Rocketman

    Member

  • Traders-Talk User
  • 807 posts

Posted 19 April 2018 - 10:26 PM

Time Cluster 4/17-20 
1. 4/19 Geometric time CIT (Change in Trend)
 
2. 4/20 Solar Time CIT
 
3. Time Square CITs from 10/11/07H:
10/11/07  39.88^2=1590 TD = 2/6/14L
42.88^2=1838 TD = 1/30/15L+1
45.88 = 2105 TD = 2/23/16L+1
48.88 = 2389 TD = 4/17/18+1
 
4. Time Squares CITs from 9/3/1929H +
55 Squared weeks = 8/25/87H
56 Squared weeks = 10/10/89H
57 Squared weeks = 12/10/91L+1
58 Squared weeks = 2/22/94H-2
59 Squared weeks = 5/21/96H+2
60 Squared weeks = 09/01/98L
61 Squared weeks = 12/26/00L-2
62 Squared weeks = 05/06/03 Miss
63 Squared weeks = 09/27/05+4
64 Squared weeks = 03/04/08H-4
65 Squared weeks = 8/24/10L+2
66 Squared weeks = 2/26/13L
67 Squared weeks = 09/15/15H+2
68 Squared weeks = 4/17/18+1

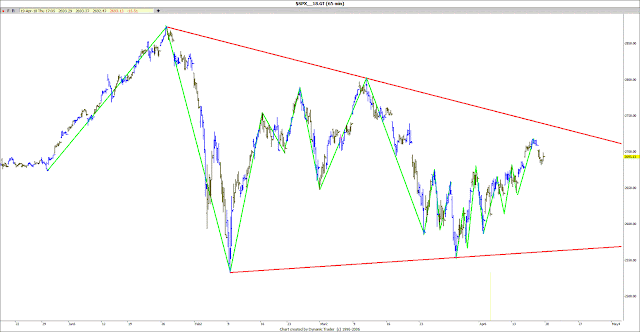
Cycle Cluster 4/18-19


spx%2Bhourly.gif

Besides the current Master Cycle (shown as the green lines on the chart), there are 2 other cycles topping out at 4/18-19H.

1. Cycle 1 is an exact Lunar Month Cycle that has several important hits: 

1. 2/09/18L+2 
2. 3/13/18H 
3. 4/02/18L+1 
4. 4/04/18L 
5. 4/18/18 swing High

2. Cycle 2 has the following hits: 

1. 3/13/18H+2 
2. 3/23/18L 
3. 4/06/18L 
4. 4/18-19 swing High
 
Conclusion: 4/18 was a swing High, Bulls Beware, you ain't seen nothing yet.


Join our free forecasts and Updates at:

Email: timeandcycles@gmail.com


#2 q4wer

q4wer

    Member

  • Traders-Talk User
  • 2,179 posts

Posted 19 April 2018 - 11:28 PM

what does it mean?


you ain't seen nothing yet.


???


it means:  you have seen something already? 


#3 Rocketman

Rocketman

    Member

  • Traders-Talk User
  • 807 posts

Posted 20 April 2018 - 05:37 AM

It means there is more declines to come that would surprise many. 


https://www.youtube.com/watch?v=99lyU5N--f8 


Edited by Rocketman, 20 April 2018 - 05:37 AM.


#4 Rocketman

Rocketman

    Member

  • Traders-Talk User
  • 807 posts

Posted 20 April 2018 - 07:30 AM

Time Square CITs from 10/11/07H: 10/11/07H  39.88^2=1590 TD = 2/6/14L
 
Explanation in simple mathematical terms: 
 
1. There are 1590 Trading Days (TD)  between 10/11/07H anf 2/06/14L
 
2. Take the Square root of 1590 = 39.88 (39.88 X 39.88 = 1590)
 
3. Increment that number by 3 to get the next number, 39.88 + 3 = 42.88
 
4. Re-square the new number: 42.88^2 = 42.88 X 42.88 = 1838.69 TD
 
5. Add that to the 10/11/07H + 1838.69 TD = 1/31/15 Low...


Time Squares CITs from 9/3/1929H + 55 Squared weeks = 8/25/87H


Explanation: 55 Squared weeks = 55 X 55 x 7 CD = 21175 CD + 9/3/29H = 8/25/87H, etc.


#5 Rocketman

Rocketman

    Member

  • Traders-Talk User
  • 807 posts

Posted 20 April 2018 - 07:43 AM

So now you can calculate the next major CIT dates for yourself:


69 Squared weeks + 9/3/29H = 12/01/2020

70 Squared weeks + 9/3/29H = 08/01/2023, etc.


#6 K Wave

K Wave

    Member

  • Traders-Talk User
  • 26,666 posts

Posted 20 April 2018 - 08:55 AM

Two words...Watch AAPL...


meltdown imminent....


The strength of Government lies in the people's ignorance, and the Government knows this, and will therefore always oppose true enlightenment. - Leo Tolstoy


#7 Rocketman

Rocketman

    Member

  • Traders-Talk User
  • 807 posts

Posted 20 April 2018 - 11:34 AM

I tend to agree, Aapl is the market leader on the way Up and down, below the 3/23L and 4/4L at 164.70, the decline should accelarate.


#8 Rocketman

Rocketman

    Member

  • Traders-Talk User
  • 807 posts

Posted 22 April 2018 - 08:34 AM

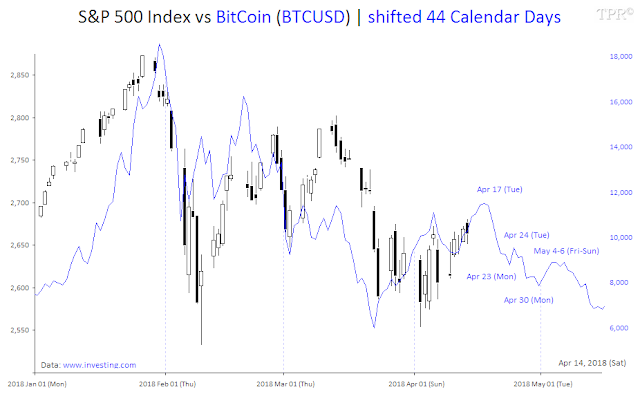
I first discovered a  Bitcoin cycle shifted 40-41 CD to predict the SPX back  on 2/5/18.

My friend Georg from http://time-price-re...in.blogspot.ca/ upon my request updated the Bitcoin Chart shifted +44. here are the results. The Updated Bitcoin Cycle supports the Master Cycle (MC) and the two other active Cycles suggesting an 4/18 major High. Please note the MC, which has precedent, has a different path than the Bitcoin cycle after some time.  


Saturday, April 14, 2018


S&P 500 Index vs BitCoin | shifted 44 Calendar Days
 

180414%2BS%2526P%2B500%2BIndex%2Bvs%2BBi


The correlation between Bitcoin prices shifted 44 Calendar Days into the future and the S&P 500 was discovered by Raj Time and Cycles (HERE + HERE). The correlation cycle is not perfect; it contracts and stretches ± 2 calendar days. Currently a 44 calendar day correlation points to a major high in the S&P 500 around April 17 (Tue).


Join our free forecasts and Updates at:
Email: timeandcycles@gmail.com