lets hear some fearless forecasts for the SPX 500 over the next 3 months

Survey: what is your IT call -spx - next 3 months ?
Started by
trioderob
, May 02 2018 11:52 AM
10 replies to this topic
#2

Waver
-

- Traders-Talk User
- 802 posts
Member
Posted 02 May 2018 - 12:38 PM
IMO - This consolidation will lead to a Bullish Resolution to new all time highs within the next next 3 months.
#3
andr99
-

- Traders-Talk User
- 7,431 posts
Member
Posted 02 May 2018 - 01:55 PM
bottom in late May - early June ( 2430 spx ? ) then resumption of the bull.....which means up until March 2019
Edited by andr99, 02 May 2018 - 02:00 PM.
forever and only a V-E-N-E-T-K-E-N - langbard
#4
andr99
-
- Traders-Talk User
- 7,431 posts
Member
Posted 02 May 2018 - 03:08 PM
with just two replies to this topic, I' m asking myself if it wouldn't be better to call this forum the fearfull forecasters
forever and only a V-E-N-E-T-K-E-N - langbard
#5
tsharp
-

- Traders-Talk User
- 1,487 posts
Member
Posted 02 May 2018 - 04:46 PM
I've been posting this chart for just over two years now... the SPX is presently in wave-iv, which should complete at 2400-2500 in perhaps 30-60 days, then on upward to ~3600...
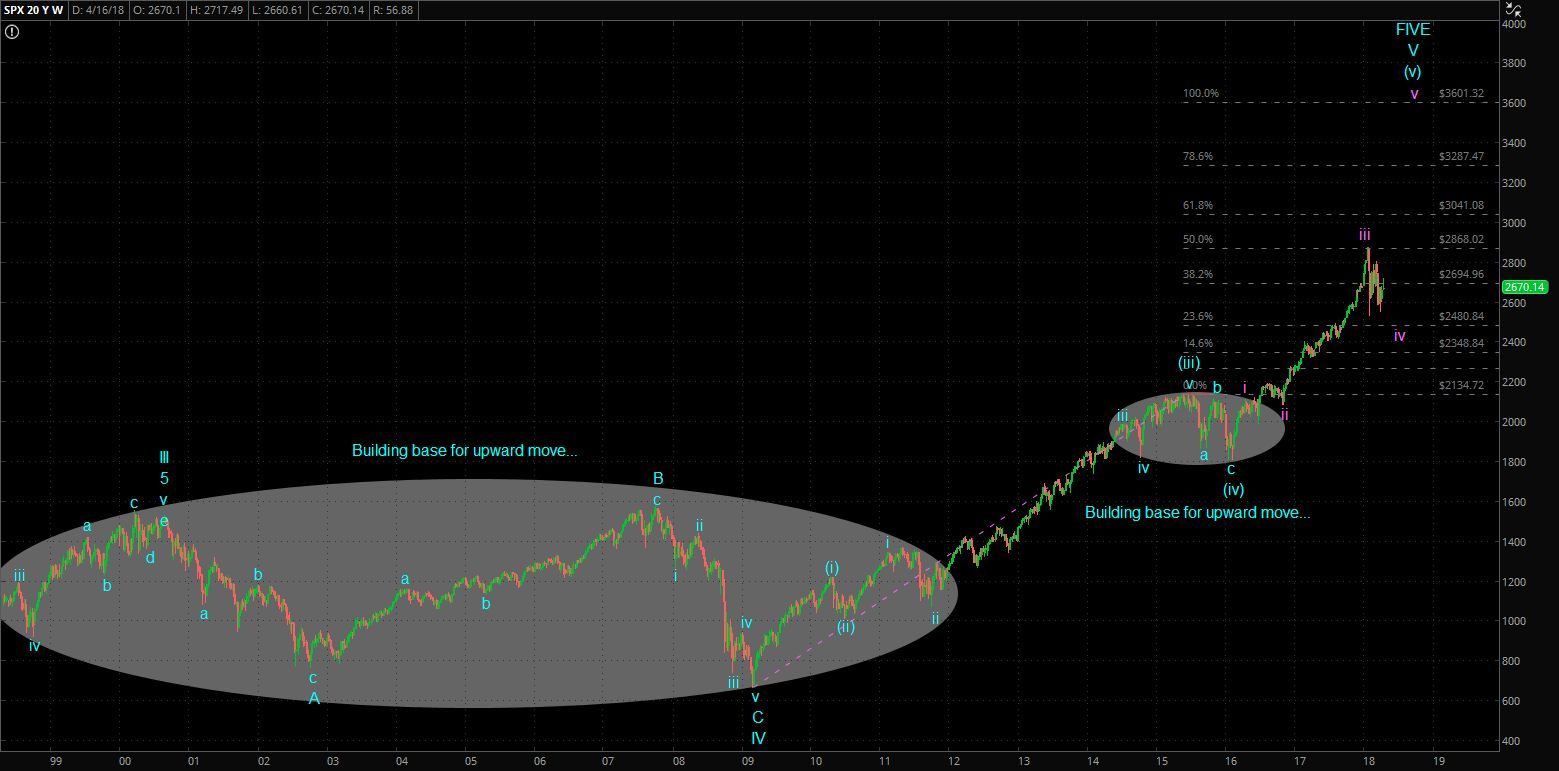
Link to chart: https://postimg.cc/image/okgfow4a1/
#6
prognosticator
-

- Traders-Talk User
- 110 posts
Member
Posted 02 May 2018 - 07:23 PM
Up to around 2840 in a short time and then a seemingly endless string of losses for years to come.
Difficult times lie ahead for many.
#7
alexnewbee
-

- Traders-Talk User
- 1,459 posts
Member
Posted 03 May 2018 - 01:14 AM
up into end of June to test ATH, then down for 2-3 years.
"we do G.d's work" Lloyd Blankfein
#8
Geomean
-

- Traders-Talk User
- 1,177 posts
Member
Posted 03 May 2018 - 11:11 AM
I've been posting this chart for just over two years now... the SPX is presently in wave-iv, which should complete at 2400-2500 in perhaps 30-60 days, then on upward to ~3600...
Link to chart: https://postimg.cc/image/okgfow4a1/
I think there is a lot of merit in your count, not the least of which is that the monthly, weekly Elliott Oscillator hit a high in January. Do you have an alternate count? If so, may I ask, since I'm struggling with this question, what might cause you to give increased weight to your alternate count? TIA T
Opportunity knocks on your door every day-answer it.
#9
tsharp
-
- Traders-Talk User
- 1,487 posts
Member
Posted 03 May 2018 - 11:46 AM
Geo,
Thank you for the kind words...
For now my alt count would be the FIVE only being a THREE... though I lend a lot of credence to Martin Armstrong's computer model suggesting the baton of financial leadership of the world goes to China in ~2032, though if that transition takes longer, there could be one more wave upward. I would also not be surprised that in this transition, a Wave-B that moves higher than the WAVE-FIVE could also be possible, thus fooling many... time will tell, and that is still some years out.
#10
Geomean
-
- Traders-Talk User
- 1,177 posts
Member
Posted 03 May 2018 - 03:20 PM
Thanks T
Opportunity knocks on your door every day-answer it.


