Jump to content


Photo

I pointed this out last night...


  • Please log in to reply
9 replies to this topic

#1 OEXCHAOS

OEXCHAOS

    Mark S. Young

  • Admin
  • 22,017 posts

Posted 04 May 2018 - 12:10 PM

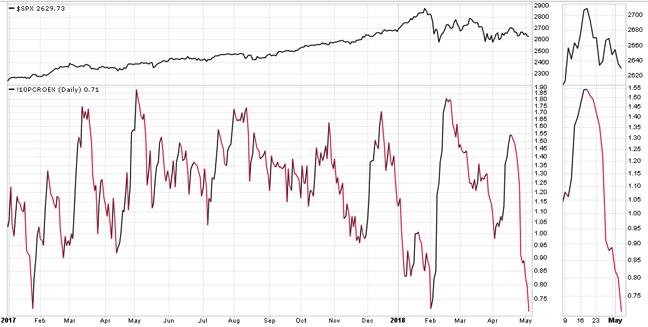
The OEX 10-day is not a surgical timing tool but it does give you a pretty good heads up when you ought to be looking up, not down. Get on there and take a look over the years. When we get low as we are now, it pays to be thinking long. Maybe you have to wait a bit, maybe the lows already in. But no matter what, you should be taking your buy signals.
 

OEX10-dayPC2018.gif
(chart courtesy StockCharts.com)


Mark S Young
Wall Street Sentiment
Get a free trial here:
http://wallstreetsen...t.com/trial.htm
You can now follow me on twitter


#2 NAV

NAV

    Member

  • Traders-Talk User
  • 16,087 posts

Posted 04 May 2018 - 12:21 PM

Sea change in sentiment - current vs Jan top. AAII bullishness in gutter and Investors Intelligence sentiment has improved. Third touch of 200 MA held. Start connecting the dots.


For the first time since Feb, i am getting a feeling that we may have the necessary setup to start an IT rally. But let's clear SPX 2683 first.


Edited by NAV, 04 May 2018 - 12:23 PM.

"It's not the knowing that is difficult, but the doing"


https://twitter.com/Trader_NAV


#3 bighouse1006

bighouse1006

    Member

  • Traders-Talk User
  • 577 posts

Posted 04 May 2018 - 12:52 PM

We are going much higher.

#4 MaryAM

MaryAM

    Member

  • Traders-Talk User
  • 1,200 posts

Posted 05 May 2018 - 05:31 AM

As long as the FED keeps doing this instead of dumping this junk on the market - of course the stock market will go higher - where else is the money going to go?  Keep in mind there is no precedent in the history of the world for central banks to governments purchasing private debt to artificially hold up an economy.  The outcome is unpredictable.


https://fred.stlouis...org/series/MBST


#5 alexnewbee

alexnewbee

    Member

  • Traders-Talk User
  • 1,459 posts

Posted 05 May 2018 - 07:57 AM

https://twitter.com/...511445249216512


"we do G.d's work" Lloyd Blankfein

#6 ryanoo

ryanoo

    Member

  • Traders-Talk User
  • 660 posts

Posted 05 May 2018 - 09:28 AM

ur account is protected, not visible to this unsuspecting visitor..


#7 alexnewbee

alexnewbee

    Member

  • Traders-Talk User
  • 1,459 posts

Posted 05 May 2018 - 11:30 AM


ur account is protected, not visible to this unsuspecting visitor..


it's not my, Atilla :)


"we do G.d's work" Lloyd Blankfein

#8 12SPX

12SPX

    Member

  • Traders-Talk User
  • 12,477 posts

Posted 05 May 2018 - 11:35 AM

The OEX 10-day is not a surgical timing tool but it does give you a pretty good heads up when you ought to be looking up, not down. Get on there and take a look over the years. When we get low as we are now, it pays to be thinking long. Maybe you have to wait a bit, maybe the lows already in. But no matter what, you should be taking your buy signals.


attachicon.gifOEX10-dayPC2018.gif
(chart courtesy StockCharts.com)

Ya was noticing that to, could be interesting for sure!!


#9 Dex

Dex

    Member

  • Traders-Talk User
  • 2,692 posts

Posted 05 May 2018 - 12:34 PM

The OEX 10-day is not a surgical timing tool but it does give you a pretty good heads up when you ought to be looking up, not down. Get on there and take a look over the years. When we get low as we are now, it pays to be thinking long. Maybe you have to wait a bit, maybe the lows already in. But no matter what, you should be taking your buy signals.


attachicon.gifOEX10-dayPC2018.gif
(chart courtesy StockCharts.com)


Isn't the OEX 10-day  used for trending markets - i.e. up/down?   


Since Feb, it appears to me we are in a range bound market in which the OEX 10 day is not appropriate or is of less value then a oscillator type indicator.


Let me know if my assumption is correct.

Thanks


"The secret of life is honesty and fair dealing. If you can fake that, you've got it made. "
17_16


#10 OEXCHAOS

OEXCHAOS

    Mark S. Young

  • Admin
  • 22,017 posts

Posted 06 May 2018 - 05:06 PM

I use it as a bottom spotter and as a condition indicator. Below 120, generally Bullish. Above 165 a bit Bearish (warning, not a Sell signal).


M


Mark S Young
Wall Street Sentiment
Get a free trial here:
http://wallstreetsen...t.com/trial.htm
You can now follow me on twitter