Jump to content


Photo

BULLISH


  • Please log in to reply
22 replies to this topic

#11 ryanoo

ryanoo

    Member

  • Traders-Talk User
  • 660 posts

Posted 10 May 2018 - 10:39 AM

SPX continuing to press upward... it seems the overhead DTL would be as good a place as any to rest at a smaller wave-i... time will tell.


SP00_60_5.10.18.jpg


Link to chart: https://postimg.cc/image/72vgvpy0p/

or, punch through the DTL first, then backtest for wave-ii ?


#12 tsharp

tsharp

    Member

  • Traders-Talk User
  • 1,487 posts

Posted 10 May 2018 - 11:25 AM

Mebbe that will be the case... I try to just take things one move at a time at the smaller scales... target hit!


SP00_240_5.10.18.jpg


Link to chart:  https://postimg.cc/image/5mojr2kex/


#13 tsharp

tsharp

    Member

  • Traders-Talk User
  • 1,487 posts

Posted 10 May 2018 - 11:36 AM

There's also the possibility that we've only seen a wave-i, running wave-ii and wave-iii (as the minuette level) are underway now... if that's the case, the blow-past the DTL is a much higher possibility... time will tell.


#14 tsharp

tsharp

    Member

  • Traders-Talk User
  • 1,487 posts

Posted 11 May 2018 - 08:41 AM

Here's a view of the daily SP00s as a proxy for the SPX...  the present count after the wave-iv low is not clear yet... I'm showing a wave-i, running wave-ii, with wave-iii in progress, but it just as easily could be a wave-i, with a wave-ii in progress... time will tell.


SP00_D_5.10.18.jpg


Link to chart:  https://postimg.cc/image/69xkaxou1/


#15 tsharp

tsharp

    Member

  • Traders-Talk User
  • 1,487 posts

Posted 12 May 2018 - 12:49 PM

From my Insta post earlier today...


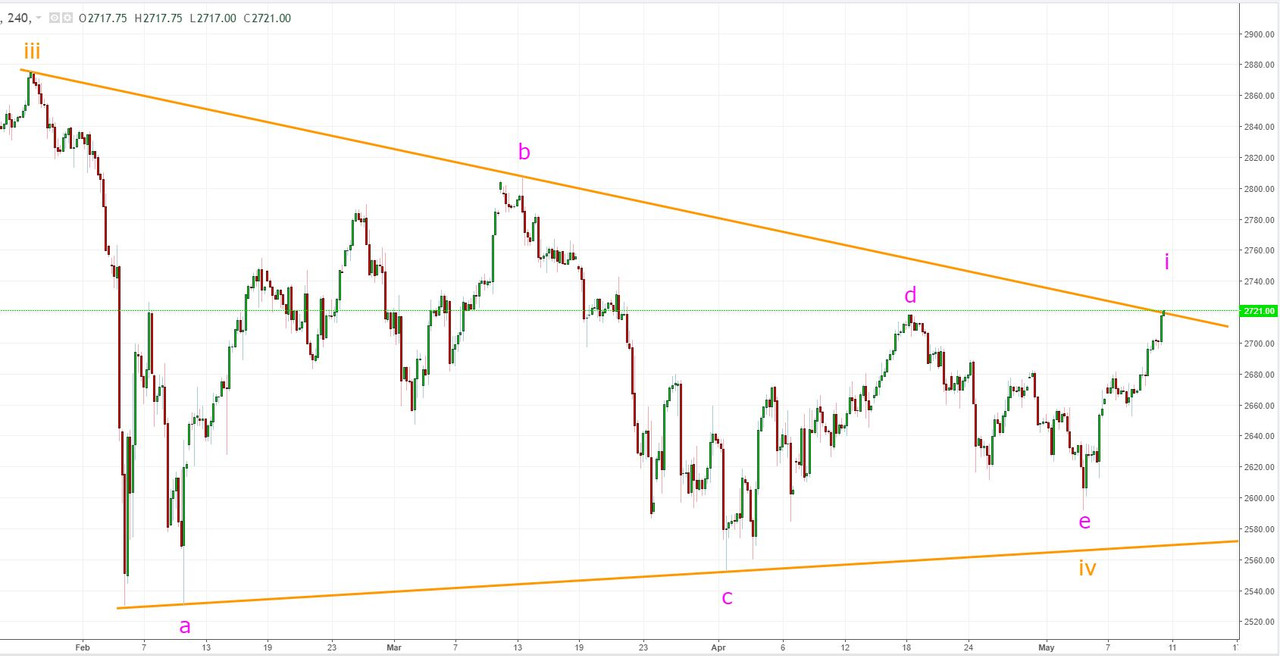
The hourly SPX chart seems to clearly state the intent of the US markets...


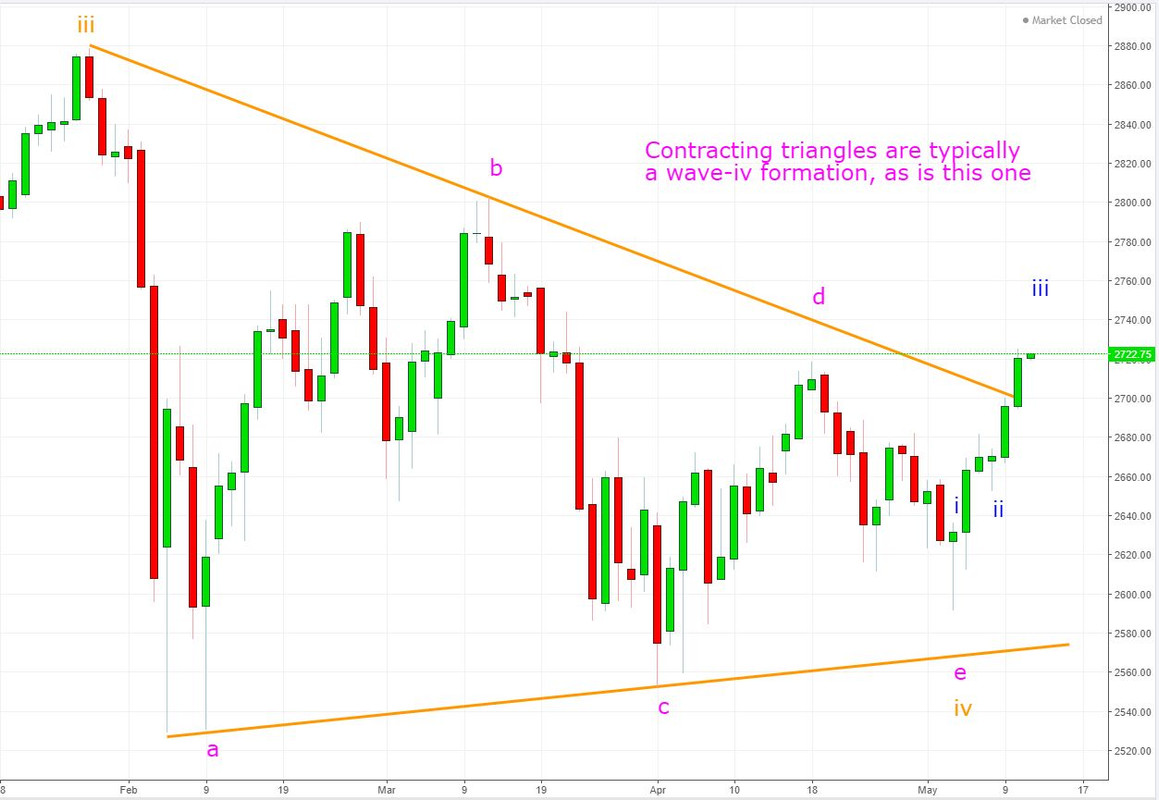
A fractal wave pattern particular to the wave-iv position - a (3-3-3-3-3) contracting triangle...


Completion of the wave-e:iv within three SPX points of my first target published on 3.11.18 - ~2592 V ~2595...


Coming up through the green DTL on the indicator chart, back-testing it, then launching upward from there...


And last, but not least, the price gapping upward through through the DTL of the upper triangle channel...


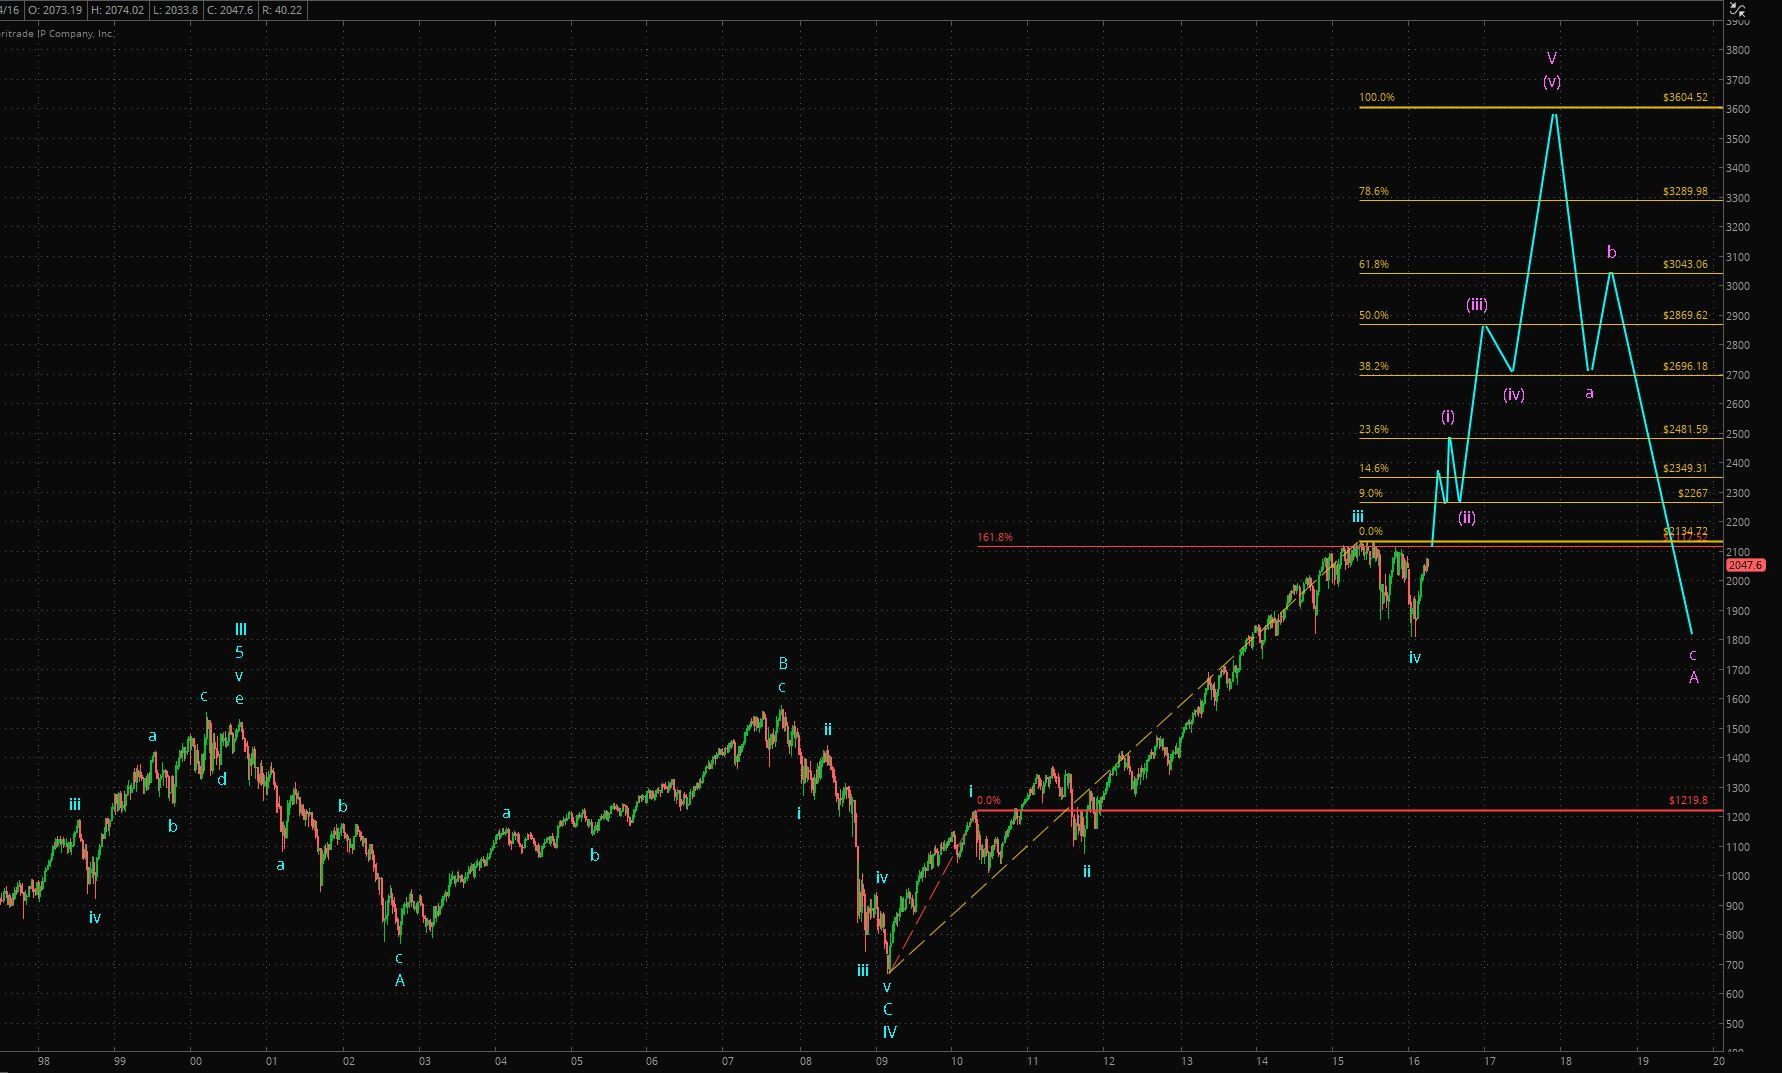
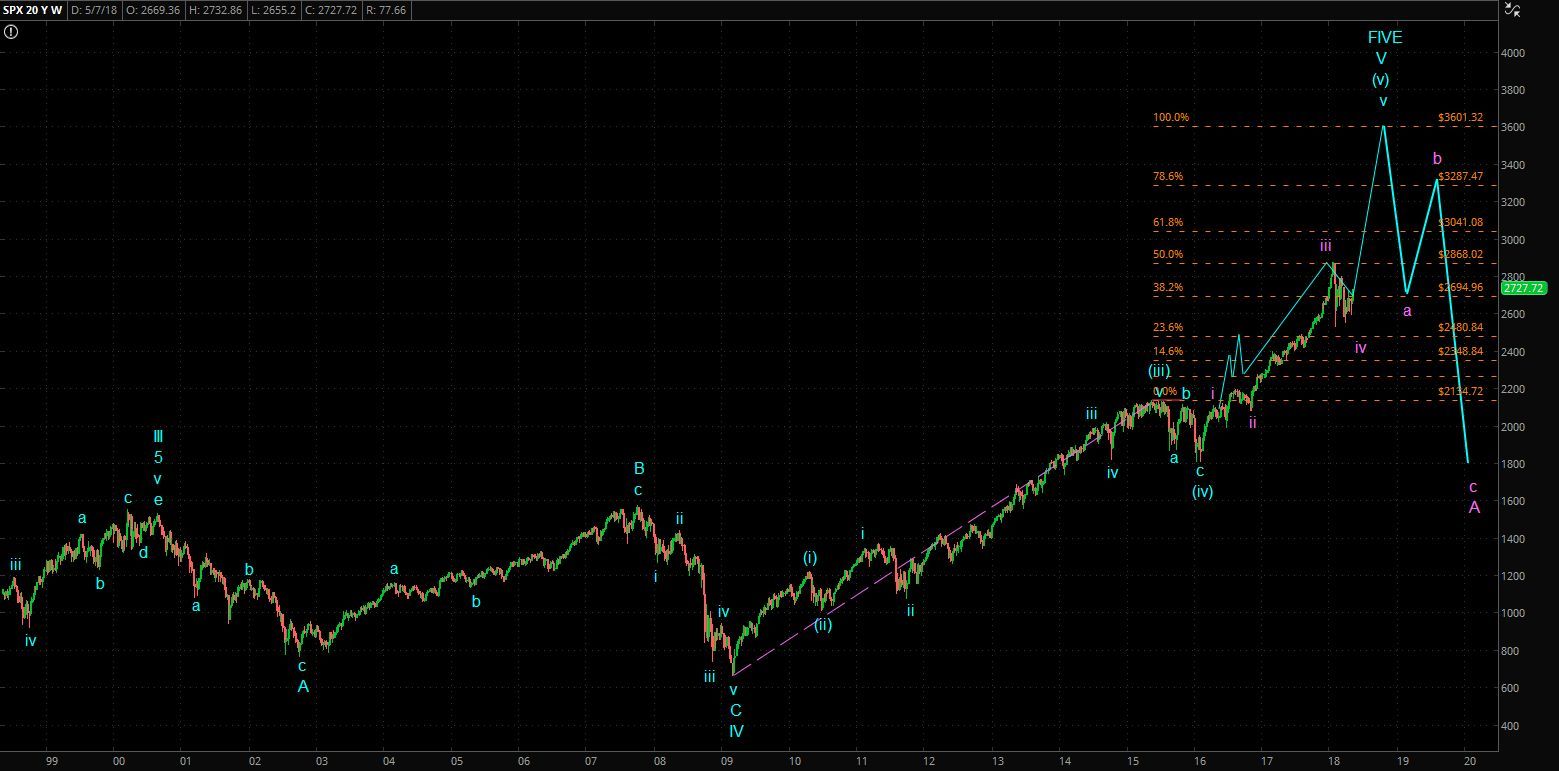
IMHO, all this points to the wave-iv completion and the commencing of wave-v, with an upward target of ~3600, basis the SPX... as always... time will tell.


SPX_60_5.11.18.jpg


Link to chart:  https://postimg.cc/image/lr7qswiex/


#16 Waver

Waver

    Member

  • Traders-Talk User
  • 802 posts

Posted 12 May 2018 - 01:25 PM

TSharp
How do you formulate 3600? Usually the price target for a triangle is the price width within the triangle plus the starting point. Where does 3600 come from?

Thanks in advance!

#17 MDurkin

MDurkin

    Member

  • Traders-Talk User
  • 638 posts

Posted 12 May 2018 - 03:51 PM

Here's one view of 3600 target using T Theory.


http://stockcharts.c...c/1649458/tenpp


#18 tsharp

tsharp

    Member

  • Traders-Talk User
  • 1,487 posts

Posted 12 May 2018 - 06:46 PM

Waver,


My projection for ~3600 SPX had nothing to do with the contracting triangle... that only settled the wave-iv matter.  My projection for ~3600 was from my fractal road map first published on 4.9.16:


SPX_W_EW_4.9.16_-_Alt.jpg


Chart link:  https://postimg.cc/image/h1w1snruh/


Here's the same chart with the overlay as of last Friday:


SPX_W-_EW_Projection_5.11.18.jpg


Link to chart:  https://postimg.cc/image/4ahvmbaeh/


#19 12SPX

12SPX

    Member

  • Traders-Talk User
  • 12,503 posts

Posted 14 May 2018 - 07:39 AM

Waver,


My projection for ~3600 SPX had nothing to do with the contracting triangle... that only settled the wave-iv matter.  My projection for ~3600 was from my fractal road map first published on 4.9.16:


SPX_W_EW_4.9.16_-_Alt.jpg


Chart link:  https://postimg.cc/image/h1w1snruh/


Here's the same chart with the overlay as of last Friday:


SPX_W-_EW_Projection_5.11.18.jpg


Link to chart:  https://postimg.cc/image/4ahvmbaeh/

Thats great and all but you moved your lines so this isnt the actual chart. Your original chart shows your peak at 12/17 3600 so your prediction is just plain wrong sorry.  


#20 NAV

NAV

    Member

  • Traders-Talk User
  • 16,087 posts

Posted 14 May 2018 - 09:59 AM

Tsharp,


If it hits 3600, it will be one hell of a call. I will be the first to congratulate you on that.


"It's not the knowing that is difficult, but the doing"


https://twitter.com/Trader_NAV