
Anybody Notice This?
Started by
OEXCHAOS
, May 30 2018 08:31 AM
11 replies to this topic
#1

OEXCHAOS
-
- Admin
- 22,017 posts
Mark S. Young
Posted 30 May 2018 - 08:31 AM
Mark S Young
Wall Street Sentiment
Get a free trial here:
http://wallstreetsen...t.com/trial.htm
You can now follow me on twitter
#2
12SPX
-

- Traders-Talk User
- 12,477 posts
Member
Posted 30 May 2018 - 09:49 AM
And there she goes, quite the pop, think there was a little to much bearishness!
#3
SemiBizz
-

- Traders-Talk User
- 23,208 posts
Volume Dynamics Specialist
Posted 30 May 2018 - 11:12 AM
We just need a few more suckers, er - I mean bulls here...
Europe's problems didn't go away today...
Classic Month End Mark Up...
They set up the risk/reward for long into the end of the month yesterday...
Friday's employment #s will be sold, they are taking the mark up in advance here,
down into mid-June
Edited by SemiBizz, 30 May 2018 - 11:13 AM.
Price and Volume Forensics Specialist
Richard Wyckoff - "Whenever you find hope or fear warping judgment, close out your position"
Volume is the only vote that matters... the ultimate sentiment poll.
http://twitter.com/VolumeDynamics http://parler.com/Volumedynamics
Richard Wyckoff - "Whenever you find hope or fear warping judgment, close out your position"
Volume is the only vote that matters... the ultimate sentiment poll.
http://twitter.com/VolumeDynamics http://parler.com/Volumedynamics
#4
Data
-

- Validating
- 2,618 posts
Member
Posted 30 May 2018 - 11:26 AM
The FANGs were up yesterday and sharply into the close by 2 points in the last hour. They comprise a good percentage of the market's capitalization.
#5
trioderob
-

- Traders-Talk User
- 1,295 posts
Member
Posted 30 May 2018 - 11:30 AM
$ trin was at 2 yesterday - classic bounce today
#6
gm_general
-

- TT Member+
- 1,653 posts
Member
Posted 30 May 2018 - 01:32 PM
A low relative VIX is bullish - for the VIX. Low would be .60-.75 or so. High meaning buy stocks has traditionally been over 1.7. Its around 1 now which I think is inconclusive. I did a study of relative VIX (which I used to swear by) and I found no reliable correlation.
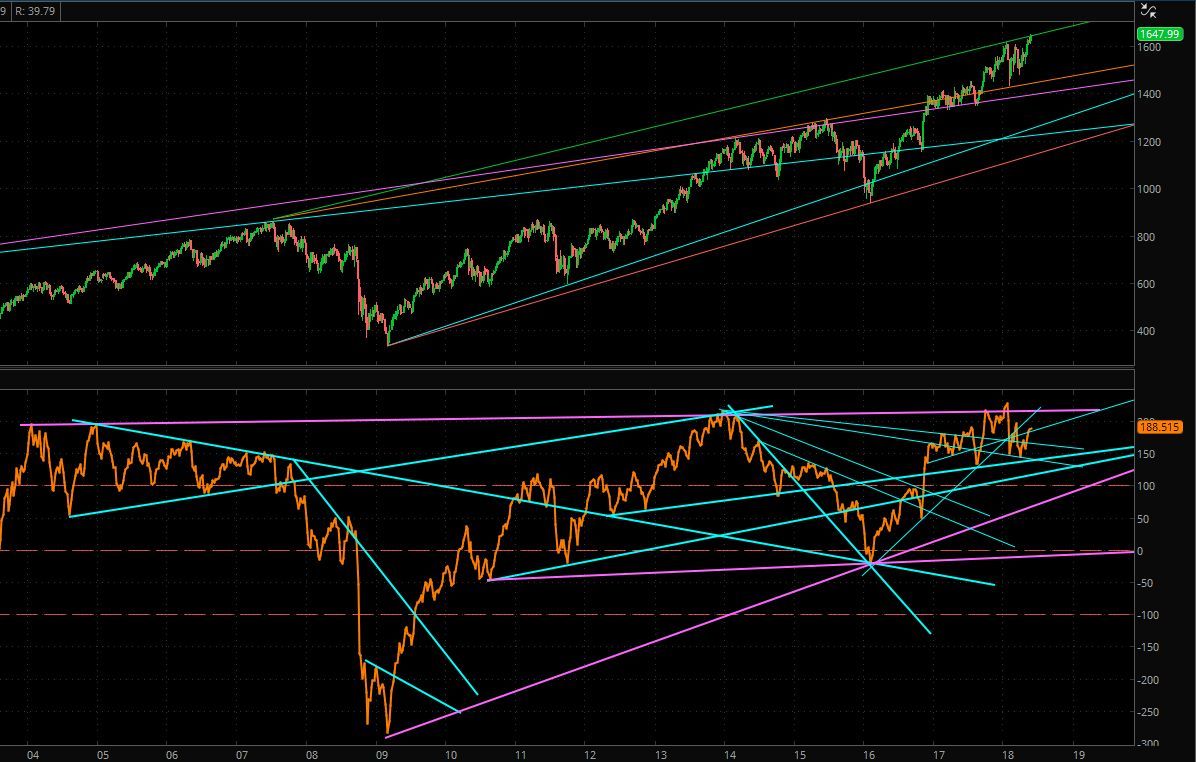
But the current VIX trend lines, those are of interest. In the chart below the main line of interest is a declining one that used to be a line of resistance, when it was broken to the upside, we got the market dump. Now it is a line of support as you can see.
Also of interest are the MACD trend lines, we now seem to be paying attention to the long parallel lines. Before it was a set of converging lines.
#7
Data
-
- Validating
- 2,618 posts
Member
Posted 30 May 2018 - 01:44 PM
Or the VIX is about 10 points above actual volatility or 3-4 standard deviations outside the bands.
#8
TradeMark
-

- Traders-Talk User
- 809 posts
Member
Posted 30 May 2018 - 02:58 PM
Mark Y, could you define relative vix? Relative to what?
thanks
TM
#9
tsharp
-

- Traders-Talk User
- 1,487 posts
Member
Posted 30 May 2018 - 03:52 PM
Mark's observation seem to align with my call for much higher prices from here... just saying.
Small caps leading the way... RUT weekly making new ATHs again.
Link to chart: https://postimg.cc/image/rjx834mg9/
SPX hourly:

Link to chart: https://postimg.cc/image/6zse4nm4p/
Clue from this morning's insta update:

Link to chart: https://postimg.cc/image/4igmxf4t5/
#10
OEXCHAOS
-
- Admin
- 22,017 posts
Mark S. Young
Posted 30 May 2018 - 04:19 PM
Mark Y, could you define relative vix? Relative to what?
thanks
TM
Relative to it's own 200-day SMA. It's an old indicator. It's one of those things that doesn't give a signal for a coon's age, and then it does. For what it's worth, I've done well with it, in context with other indicators. A relatively high VIX is motive to rally the market, unless we're in a complete panic.
M
Mark S Young
Wall Street Sentiment
Get a free trial here:
http://wallstreetsen...t.com/trial.htm
You can now follow me on twitter


