Jump to content


Photo

Still Bullish but .... TIM ORD calls for a pullback


  • Please log in to reply
6 replies to this topic

#1 dTraderB

dTraderB

    Member

  • Traders-Talk User
  • 17,212 posts

Posted 07 June 2018 - 08:54 PM

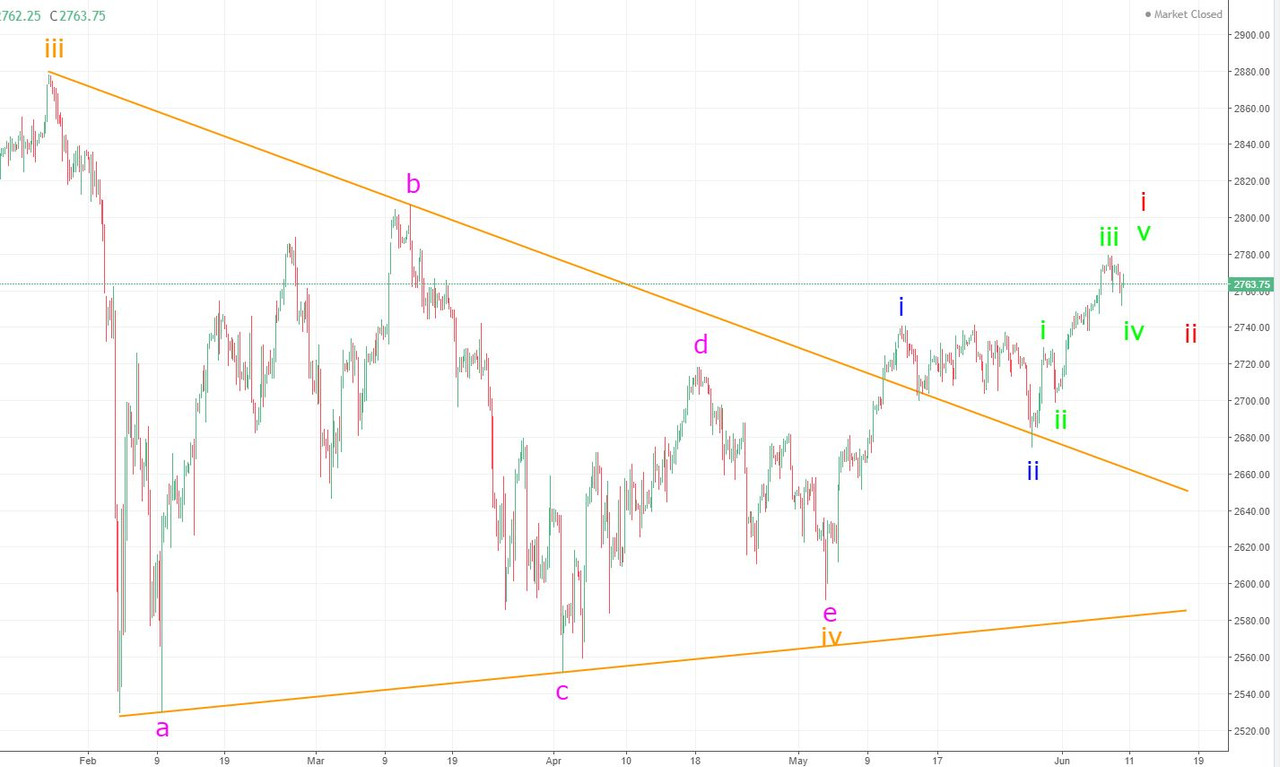
I am in agreement with TIM ORD but I must admit this very resilient market does not like to go down and badly wants to go up up up.....


"We have updated this chart from yesterday. The middle window is the VXST/VIX (Short term VIX/Volatility index).  It has been a bearish short term sign when the VXST outperforms the VIX (rising ratio).  The SPY traded above its previous high and the VXST/VIX ratio made a higher low suggesting a short term pull back is possible.  Also this is the week before option expiration week which can produce whipsaws.  Next Wednesday (June 13) is the FOMC announcement and  a cycle low is due June 13. The SPX 2800 higher target is still insight but a pause short term is possible.  The last three highs in the SPY topped at its upper Bollinger band and its back at that level again. There is an unfilled gap in the 2700 range which is a possible pullback target.  Neutral for now."


See LINK below chart.


15283934195721404543093.jpg


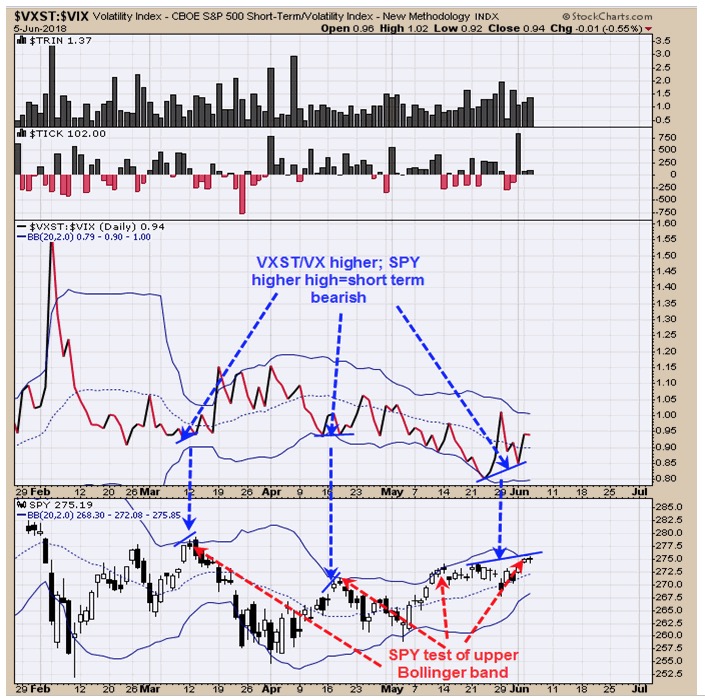
http://stockcharts.c...ne-7-2018-.html


#2 dTraderB

dTraderB

    Member

  • Traders-Talk User
  • 17,212 posts

Posted 07 June 2018 - 08:59 PM

3, 10, 21 period moving average of the equity put/call ratio in bearish levels. $SPY $SPY $QQQ $ndx


Chart here:

https://twitter.com/...842280509992961


#3 robo

robo

    Member

  • Traders-Talk User
  • 1,217 posts

Posted 08 June 2018 - 06:59 AM

We are late in cycle....


Stocks Deliver More Sell Signals
Bearish divergences are beginning to develop on the oscillators. Thursday was day 24 for the daily equity cycle. While stocks printed a new daily cycle high, they also closed lower on Thursday. Stocks printed 4 consecutive days of over 2.3 billion Selling on Strength. So if a swing high forms here it would have goods odds of sending stocks into their daily cycle decline. A break below 2760.16 would form a swing high. The a close below the break out would signal the daily cycle decline. A break of the daily cycle trend line would confirm the daily cycle decline.


“There is only one side to the stock market; and it is not the bull side or the bear side, but the right side”   Jesse L. Livermore


#4 tsharp

tsharp

    Member

  • Traders-Talk User
  • 1,487 posts

Posted 08 June 2018 - 09:59 AM

Just thinking out loud here...  from this morning's insta...


SP00_240_6.8.18.jpg


Link to chart:  https://postimg.cc/image/4rnwlwi4p/


#5 dTraderB

dTraderB

    Member

  • Traders-Talk User
  • 17,212 posts

Posted 08 June 2018 - 11:46 AM

Nice rally, testing SPX 2780

Break above that targets the next major swing hi at 2802


#6 dTraderB

dTraderB

    Member

  • Traders-Talk User
  • 17,212 posts

Posted 08 June 2018 - 11:47 AM

2760 support  SPX


#7 cycletimer

cycletimer

    Member

  • Traders-Talk User
  • 2,620 posts

Posted 08 June 2018 - 05:30 PM

Market is due for a ST, shallow pullback but nothing scary.  Markets are headed to new ATH's into early July.  Next cycle turn is not until after July 4th.  It's a time to buy pullbacks aggressively as this rally could be of the magnitude of 8-10% into July.