Jump to content


Photo

DAX about done...


  • Please log in to reply
9 replies to this topic

#1 tsharp

tsharp

    Member

  • Traders-Talk User
  • 1,487 posts

Posted 01 July 2018 - 11:22 AM

Hey all,


I was doing some weekend work and noticed the monthly DAX is about to cross the line of death...


Notice the completed fractal count...


Notice the H&S formation...


Notice the negative divergence of price to momentum...


And last, but not least, notice the indicator line is about to cross the UTL...


Once that cross takes place, the LT CIT takes place and the DAX enters into a bear market (by my standard).


DAX_M_6.30.18.jpg


Link to chart:  https://postimg.cc/image/ysu4i75tl/


#2 tsharp

tsharp

    Member

  • Traders-Talk User
  • 1,487 posts

Posted 01 July 2018 - 08:05 PM

It seems Europe is going to be entering into their respective bear markets first... the FTSE 100 appears to have just completed an EDT final fifth wave, much like the CAC 40 chart below...  though the FTSE 100 did not end with a truncated fifth wave as did the CAC 40... twt.


CAC40_M_6.30.18.jpg


Link to chart:  https://postimg.cc/image/ahtym1n7d/


#3 gannman

gannman

    Member

  • Traders-Talk User
  • 6,948 posts

Posted 02 July 2018 - 03:38 AM

this is not good to say the least 


feeling mellow with the yellow metal


#4 tsharp

tsharp

    Member

  • Traders-Talk User
  • 1,487 posts

Posted 02 July 2018 - 05:22 PM

As a follow-up on the DAX, here's the weekly chart from today... not looking good at all... double top with a pronounced H&S...


DAX_W_7.2.18.jpg


Link to chart:  https://postimg.cc/image/6wbkpmlvd/


Edited by tsharp, 02 July 2018 - 05:23 PM.


#5 gannman

gannman

    Member

  • Traders-Talk User
  • 6,948 posts

Posted 02 July 2018 - 06:09 PM

i want to be sure i understand this right  my interpretation is you are calling for a grand supercycle top , is that what you are saying ?


feeling mellow with the yellow metal


#6 tsharp

tsharp

    Member

  • Traders-Talk User
  • 1,487 posts

Posted 02 July 2018 - 08:36 PM

i want to be sure i understand this right  my interpretation is you are calling for a grand supercycle top , is that what you are saying ?


Not sure about that GSC Top part... I know Bob and company have been selling that cool aide for a very long time... I am suggesting a deep and prolonged bear market, but also suggest our landing will be more gentle than 1929, and Japan has suffered a longer market depression than we did in 1929... our market finally recovered after 25-years; theirs has still not fully recovered 28-years later!


To be sure, I think Japan's bear market is over and they are just getting started in the next phase of their bull market, but it will be tough sledding while the west goes into another bear market... AND perhaps joins the east in another leg higher... Dow 100K ???  It's a bit too far out there for me to grasp at this time.


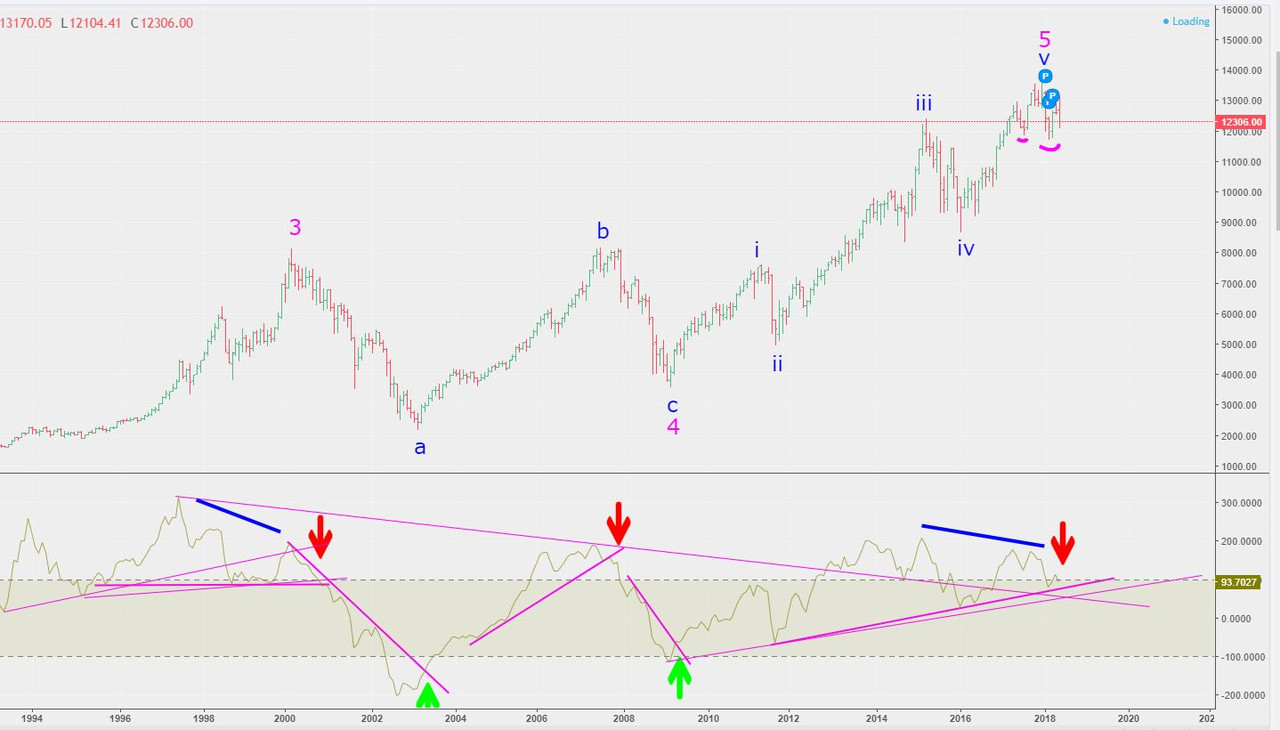
These charts should probably go into another thread, and perhaps I will create one, but to show what I'm suggesting here are three Asian major markets: the Nikkei 225, the Hang Seng and the Shanghai Composite... it appears that Martin Armstrong's computer is correct in suggesting the economic power moves eastward in the 2032 time frame.


Nikkei 225 monthly: 

N225_M_6.30.18.jpg


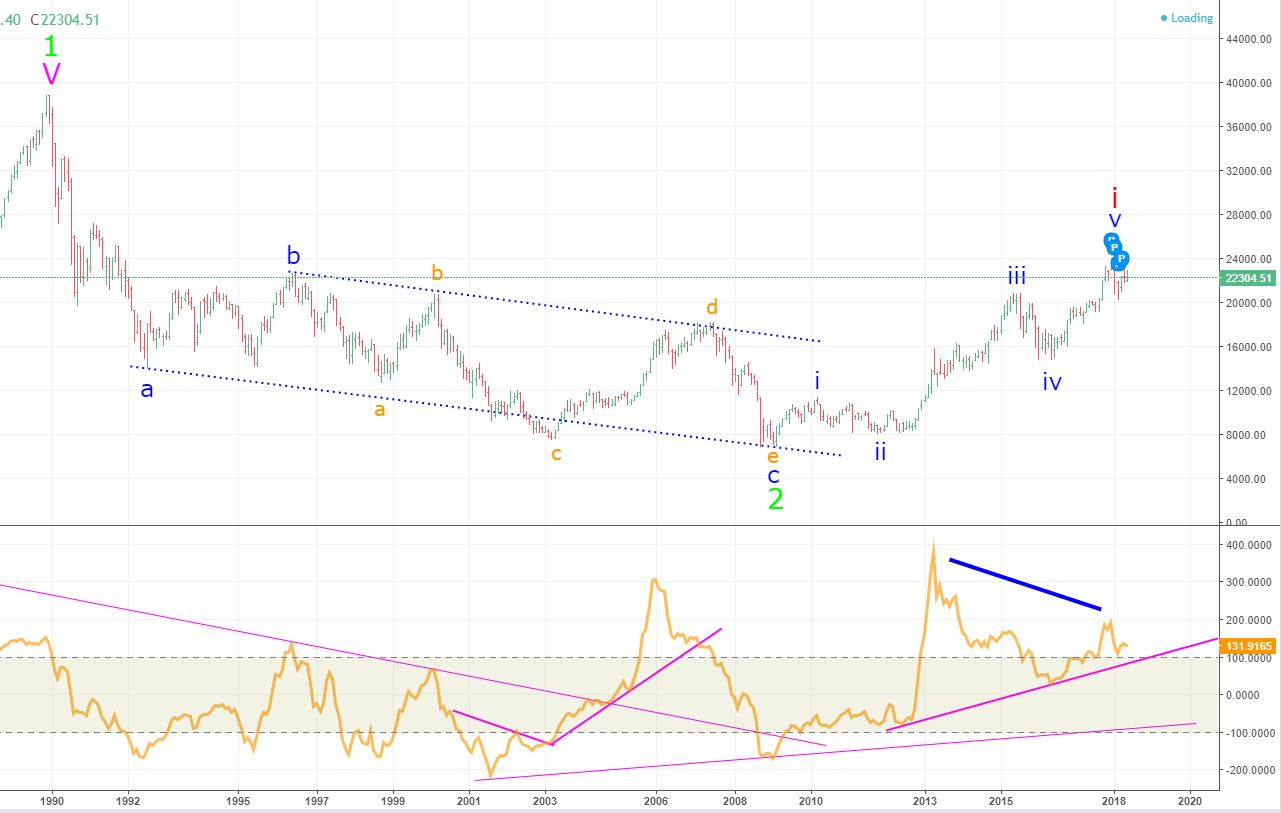
Link to chart: https://postimg.cc/image/ptr72rmyx/
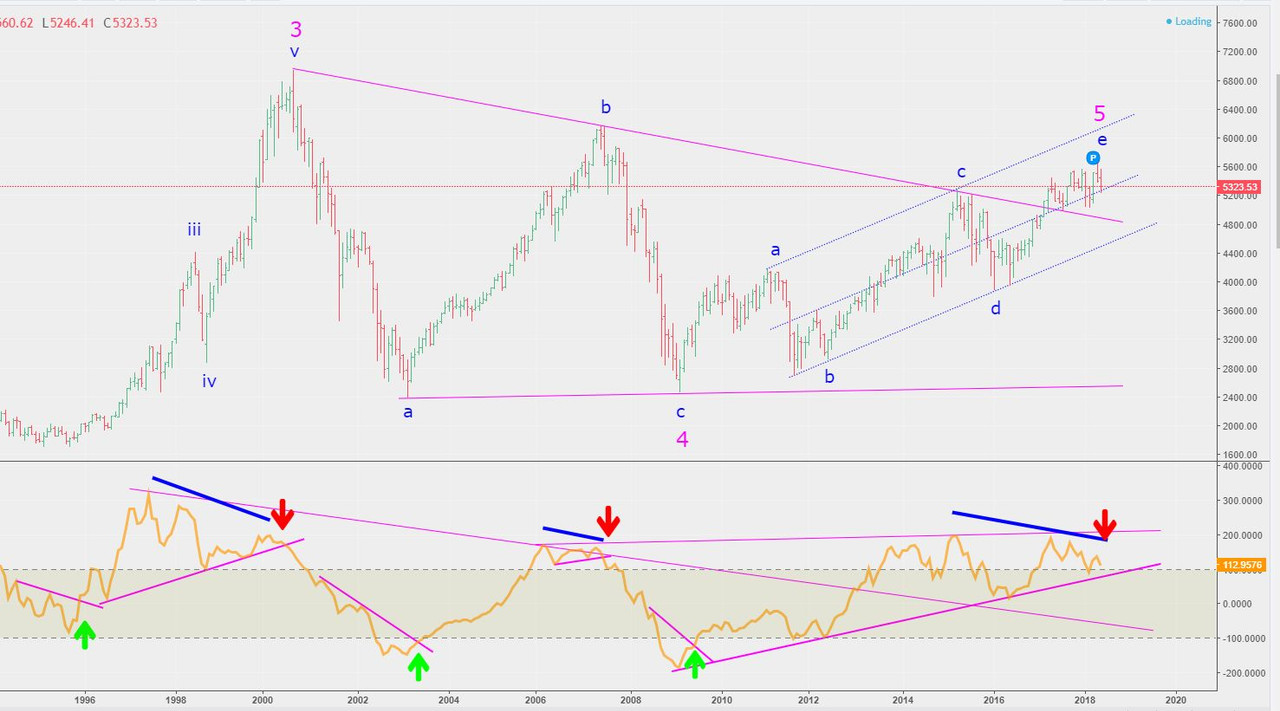
 

Hang Seng monthly: 


HK50_M_6.30.18.jpg


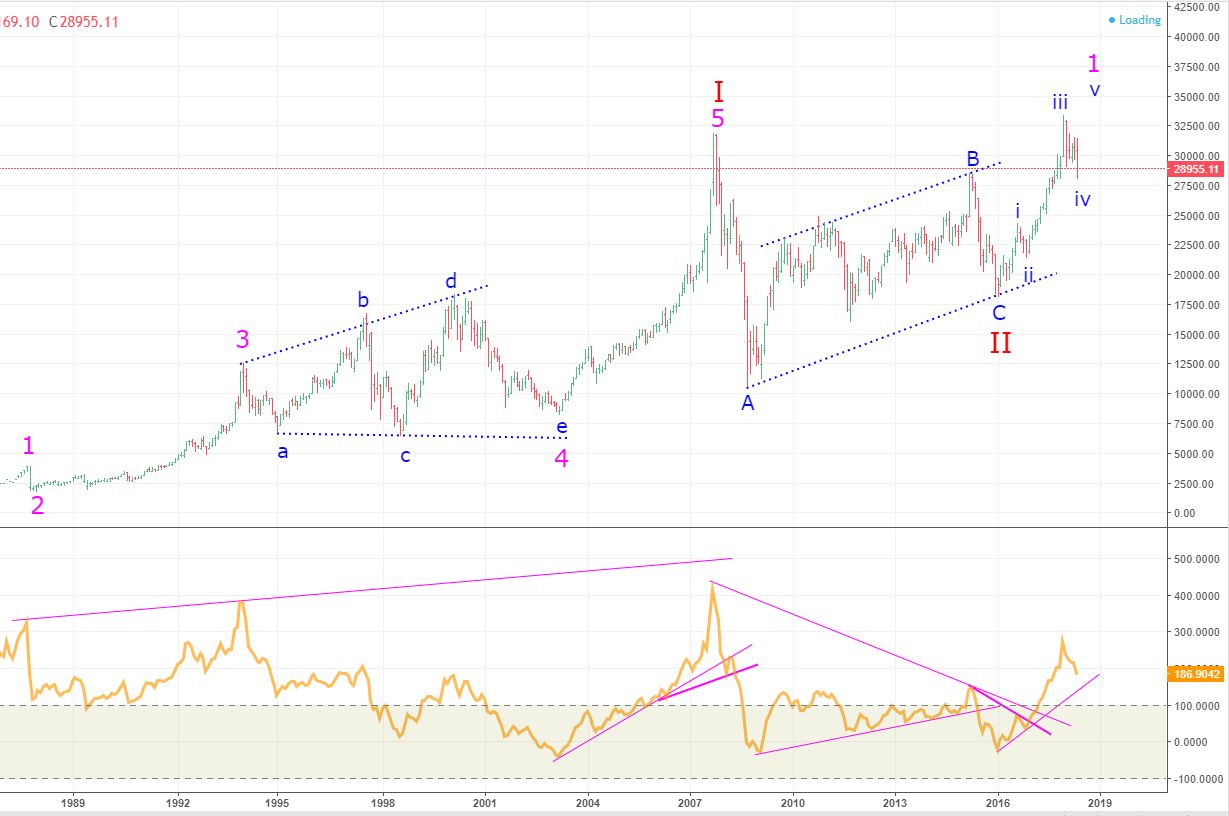
Link to chart: https://postimg.cc/image/9vihcmdbd/


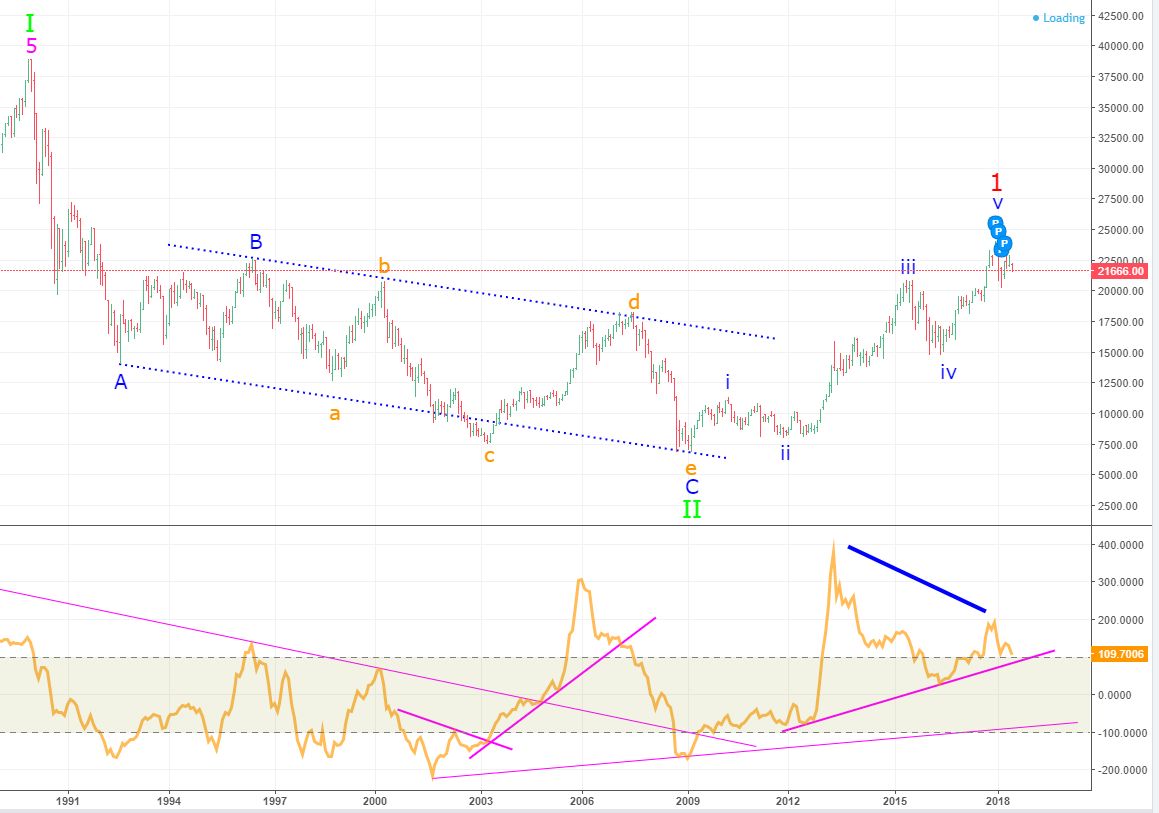
Shanghai Composite Monthly: 


Shanghai_M_6.30.18.jpg


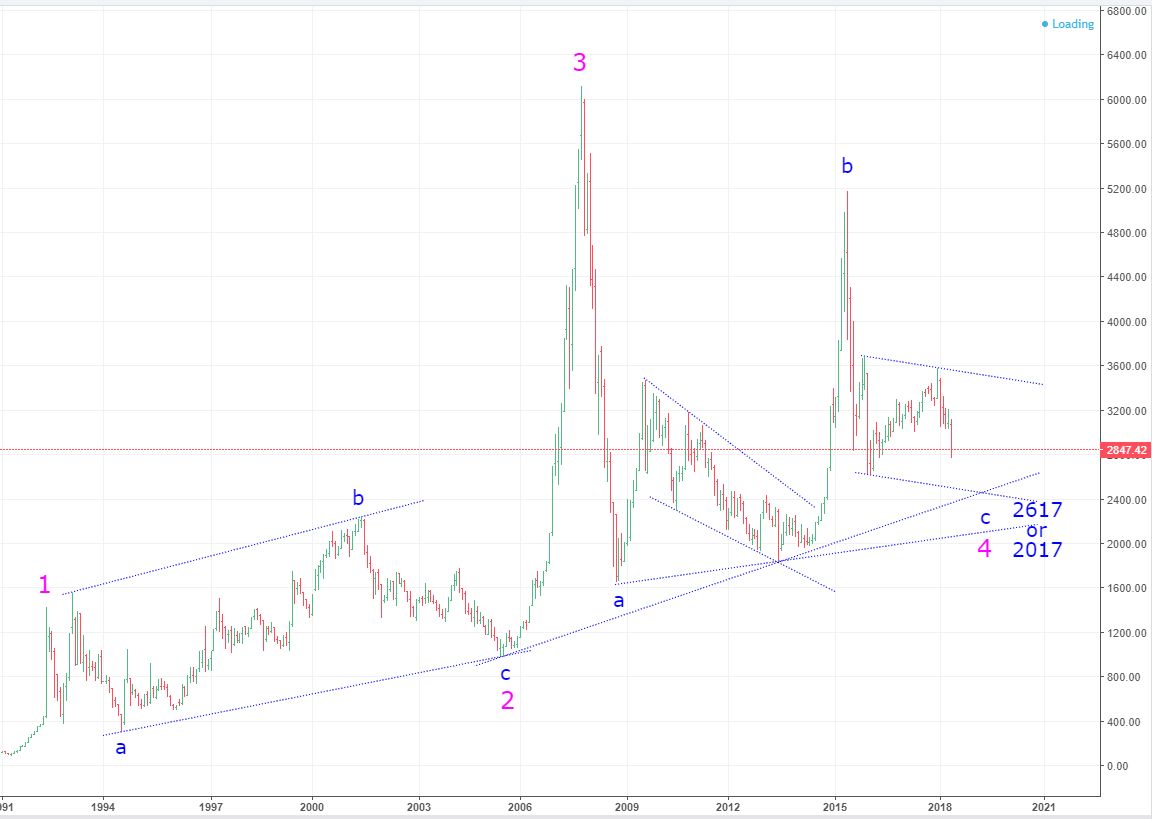
Link to chart:  https://postimg.cc/image/9vihcn0gp/


Edited by tsharp, 02 July 2018 - 08:37 PM.


#7 tsharp

tsharp

    Member

  • Traders-Talk User
  • 1,487 posts

Posted 02 July 2018 - 08:57 PM

I made Japan's chart first, and should have labeled the 1990 top as Wave-5:I, then the 2008 low as Wave-II, so then Wave-1 is just about complete or just completed.


#8 tsharp

tsharp

    Member

  • Traders-Talk User
  • 1,487 posts

Posted 02 July 2018 - 10:20 PM

I made Japan's chart first, and should have labeled the 1990 top as Wave-5:I, then the 2008 low as Wave-II, so then Wave-1 is just about complete or just completed.


Okay... corrected chart:


N225_M_6.30.18.jpg


Link to chart:  https://postimg.cc/image/4mwn634h5/


#9 gannman

gannman

    Member

  • Traders-Talk User
  • 6,948 posts

Posted 03 July 2018 - 02:17 AM

thanks appreciate it 


feeling mellow with the yellow metal


#10 tsharp

tsharp

    Member

  • Traders-Talk User
  • 1,487 posts

Posted 03 July 2018 - 07:19 AM

i want to be sure i understand this right  my interpretation is you are calling for a grand supercycle top , is that what you are saying ?


Just a quick follow up to the GSC thing... I first started following Bob in about 1996, at that time he was calling for the GSC Top and the transition into the dark ages. 


The '97 top wasn't it...

The '98 top wasn't it...

The successive ending diagonal triangle tops of 99-00 weren't it...


I am on record here stating that the top of 2000 was only a Wave-IV, and now as we're pushing up to what seems to be a Wave-V... is it the end, or just another pause to even higher-highs?


Based on what I'm seeing from the Asian charts, the latter seems more likely... that's also why I changed to saying fractal theory, rather than EW... I see waves, just not Bob's way... but rather a blend of wave theory and Armstrong's capital flow theory.