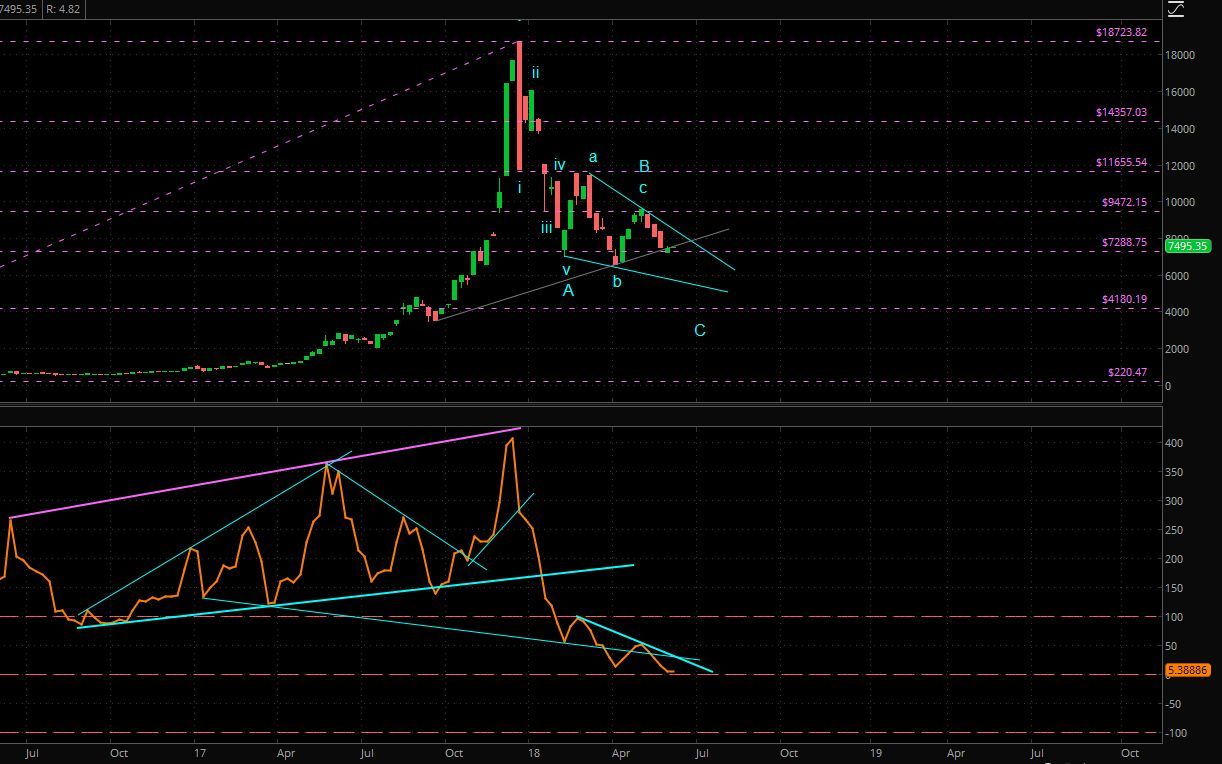
Here's a chart I prepared today of the SPX weekly in log-scale with my momentum indicator beneath.
Note how the low in 1982 established the LT trend line all the way to the top in 2000... a new LT trend line is established, and it will take a crossing of the line to the downside to mark the end of this phase of the bull market that re-started in 2009... at this time, on a percentage basis, Wave-5 is the shortest of the impulsive legs, so it may extend beyond my target of ~3600... twt.
Link to chart: https://postimg.cc/image/q7y4tsluh/
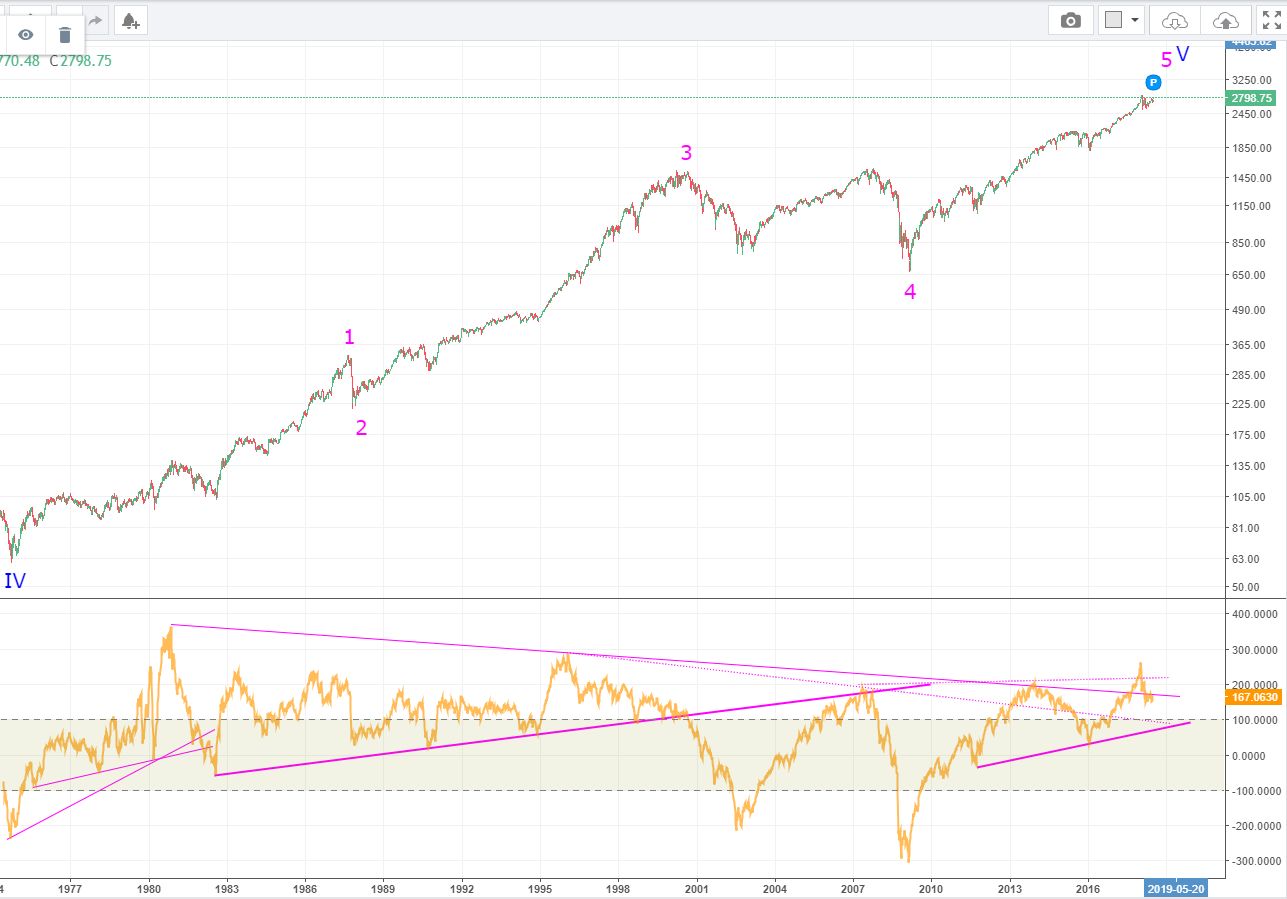
When I made my forecast on 4.9.16 for the SPX to peak in a Wave-5 at ~3600, it was based only on the the Fibonacci extension of the wave from the Wave-4 bottom to the place where the wave-iii peaked.
In looking at the SPX since 1974, it becomes clear that under normal fractal relationships, where in an impulsive five-wave sequence, the third wave CANNOT be the shortest, and it is not, but neither does it necessarily have to be the longest.
In typical impulsive moves, wave-1 and wave-5 would be about equal in length, with wave-3 being the longest.
In the chart above, we can see that in this great bull market run in the US financial markets, using the S&P 500 for a proxy, that the bull market began in 1974 at a low of ~61 up to ~338 in 1987 for an approximate 5.5X over thirteen years.
Wave-2 was a very sharp correction that ran from the week of 8.24.87 - to the week of 10.19.87, and corrected the SPX to the tune of 36% over two months, leaving the SPX at ~216.
Wave-3 picked up from there and ran from 1987 - 2000, taking the SPX from ~216 - ~1530 for an approximate 7.06X over thirteen years.
Wave-4 began the week of 8.28.2000 from a truncated fifth wave high of 1530 (an ending diagonal triangle) and lasted through the week of 3.2.2009 (nearly nine years) and corrected the market by about 56% to the low of ~667.
This takes us to the wave in which we are now operating, Wave-5. The start date of this leg of the bull market is the week of 3.2.2009, and if the Wave-1 = Wave-5 scenario plays out it would last some thirteen years, taking it out to 2022 and to a price level of ~3660.
If Wave-5 extends, meaning it becomes the longest of the impulsive waves, the price would need to exceed ~4700.
To wrap this up, note how the up-trend-line (UTL) on the momentum indicator line marked the extent of the previous two legs of the bull market from the 1982 low through the topping process in 2000.
The new UTL in this last leg up has two touches already and marks this phase of the new bull market. This leg of the bull market continues until that second UTL is broken, perhaps out in 2022, or sometime sooner, with a lower price target of ~3600 and a higher potential price in excess of ~4700... twt.