Jump to content


Photo

That Alternate SPX scenario


  • Please log in to reply
7 replies to this topic

#1 tsharp

tsharp

    Member

  • Traders-Talk User
  • 1,487 posts

Posted 20 July 2018 - 06:29 PM

I was a bit baffled as to why the last leg up ended in what appears to be an EDT... so I did some homework and this is what I came up with.\:


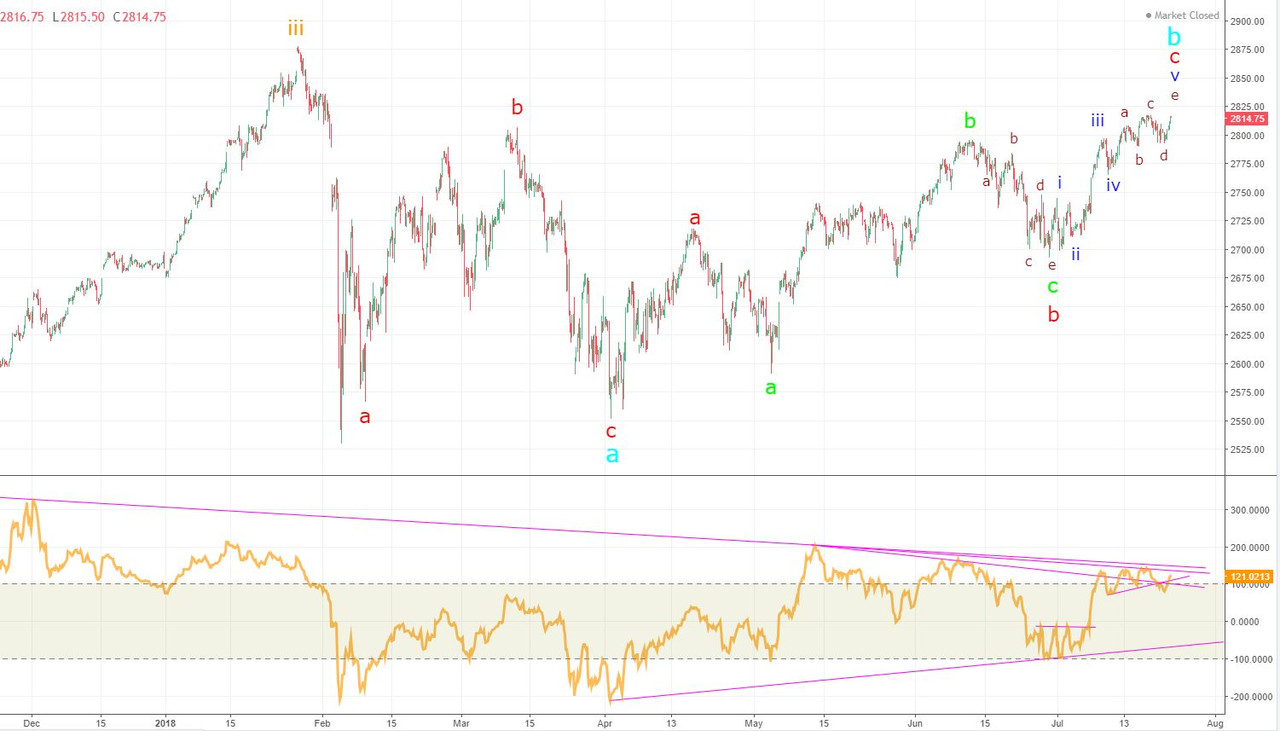
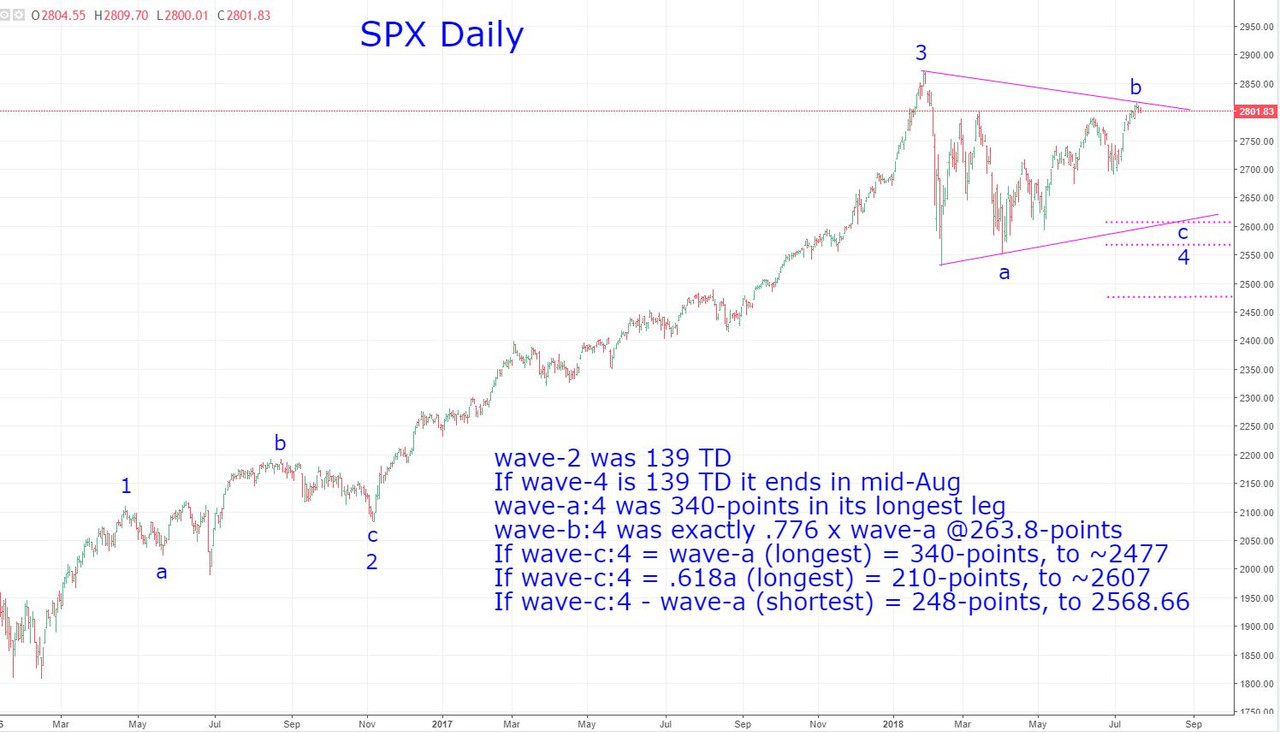
I have wave-2 in this series off the 1810 lows as a running fractal lasting some 139 trading days.  I was a bit surprised when wave-4 ended so quickly, but because it appeared to have the wave structure of a contracting diagonal triangle, which is a typical fractal for a wave-4, so I accepted it as shorter in time - which lacked symmetry within the wave.


If wave-4 was over, it seems to have had quite a bit of struggle just getting back up to even the previous wave-b:a:4 pivot of ~2801, and then the EDT of the last wave up just smells of fatigue.


So I am still left with the thought that wave-4 is not yet complete... if this is true, then consider:


-Wave-a:4 (longest leg) was from ~2817 - ~2477 for a length of 340-points.

-Wave-b:4 at its height of ~2817 was exactly .776 x wave-a (longest) @ 264-points

-If wave-c:4 = wave-a (longest), then we could expect to see wave-4 complete at ~2477

-If wave-c:4 = .618a (longest), then we could expect to see wave-4 complete at ~2607

-If wave-c:4 = wave-c:a (the shorter leg), then we could expect to see wave-4 complete at ~2569


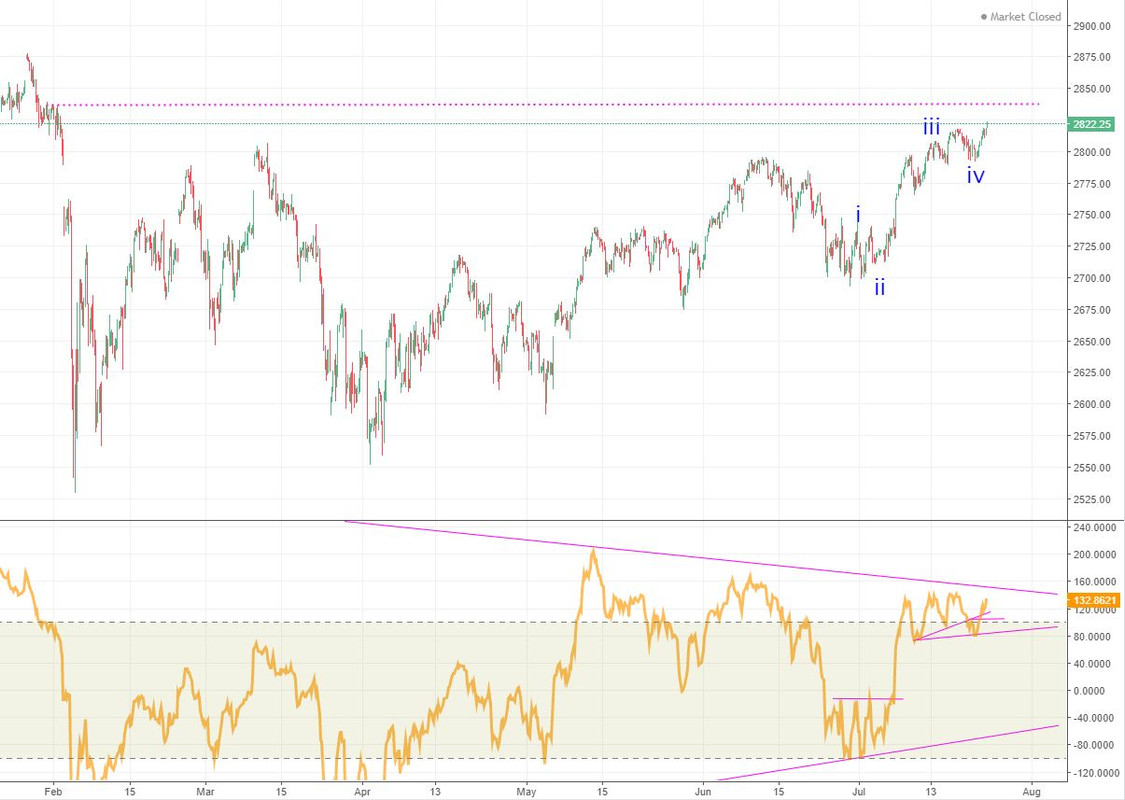
The confluence of the UTL and the highest of the targets (2607) seems to hit in the third week of August (8/23), which would also be approximately equal to the 139 TDs (8/16 actual)...


Just throwing this out there... the CDT is still a valid interpretation, and this pause could simply be the end of wave-i:V , with wave-ii in work now, and then right back up to new ATHs on the next thrust... time will tell.


Happy weekend to all here!


SPX_D_7.20.18-_ALT.jpg


Link to chart:  https://postimg.cc/image/krwxfzj2x/


#2 tsharp

tsharp

    Member

  • Traders-Talk User
  • 1,487 posts

Posted 21 July 2018 - 11:16 AM

Without all the verbiage as above, here's the same scenario for the Dow...  I'm thinking if this plays out, 23,199 is the most likely target... twt.


Dow_W_7.20.18-_ALT.jpg


Link to chart:  https://postimg.cc/image/nymvlwoft/


#3 tsharp

tsharp

    Member

  • Traders-Talk User
  • 1,487 posts

Posted 21 July 2018 - 12:22 PM

And last, but not least, the weekly NAZ with the same scenario, though I suggest NAZ may play out an expanding 4th instead... twt.


NAZ_W_7.20.18-_ALT.jpg


Link to chart:  https://postimg.cc/image/en1bvgcx5/


#4 CLK

CLK

    Member

  • Traders-Talk User
  • 10,787 posts

Posted 22 July 2018 - 09:50 AM

A monthly close at 24,000 and the bull market is over with only a retest of the highs possible.


#5 pedro

pedro

    Member

  • Traders-Talk User
  • 767 posts

Posted 22 July 2018 - 10:02 PM

There's an EWer who does nice work out of Toronto, but behind a registration wall, who takes it even further.


His view is that the coming c down soon won't end the W4 but the correction will drag into 2019 as a triangle with d and e after that.


He doesn't usually articulate his rationales, but he does try to tie things up intermarket with $ as linchpin.

We are coming up on a $ high, perhaps when c down completes.


#6 slatedrake

slatedrake

    Member

  • Traders-Talk User
  • 269 posts

Posted 23 July 2018 - 01:24 PM

Hey pedro,


I'm curious - who is the ewaver in Toronto?


Wondering if this is the long lost Teaparty aka eMiniMe


Before you start trading get your brain around risk control. Know how much leverage you're using and know when to go to cash if you're wrong.

#7 tsharp

tsharp

    Member

  • Traders-Talk User
  • 1,487 posts

Posted 23 July 2018 - 10:51 PM

It appears the highs will be limited to the fuchsia upper channel line,... watching.


SP00_60_7.23.18-2.jpg


Link to chart:  https://postimg.cc/image/atde2tdpl/


SP00_240_7.23.18.jpg


Link to chart:  https://postimg.cc/image/m5pzkleop/


Edited by tsharp, 23 July 2018 - 10:53 PM.


#8 tsharp

tsharp

    Member

  • Traders-Talk User
  • 1,487 posts

Posted 24 July 2018 - 10:00 AM

It appears the highs will be limited to the fuchsia upper channel line,... watching.


SP00_60_7.23.18-2.jpg


Link to chart:  https://postimg.cc/image/atde2tdpl/


SP00_240_7.23.18.jpg


Link to chart:  https://postimg.cc/image/m5pzkleop/


Obviously, the EDT didn't play out, as the middle impulsive wave cannot be the shortest wave... my SAR got whipsawed and flipped back to long yesterday morning, though I thought it was possible it was going to get whipsawed again this morning, but it did not.  


Charts from early this morning and just now on insta -  @milehighstrategies:


SP00_60_7.24.18-1.jpg


Link to chart: https://postimg.cc/image/txtog9u5l/


SP00_60_7.24.18-2.jpg


Link to chart:  https://postimg.cc/image/ywh6uu0jd/


SP00_240_7.24.18.jpg


Link to chart: https://postimg.cc/image/guy1wiqxl/