Jump to content


Photo

The End is Near: Growth will slow. The bull market will expire...


  • Please log in to reply
10 replies to this topic

#1 dTraderB

dTraderB

    Member

  • Traders-Talk User
  • 17,414 posts

Posted 21 July 2018 - 11:49 AM

e8b9b914c3d0ec49230fd100-750.jpg


No, I don't believe in crash every Monday morning or any particular day, I don't trade by depending on a crash or going onto crash mode, I think there will be a pop during the next few days and then down again, and there may be new highs in late 2018. 

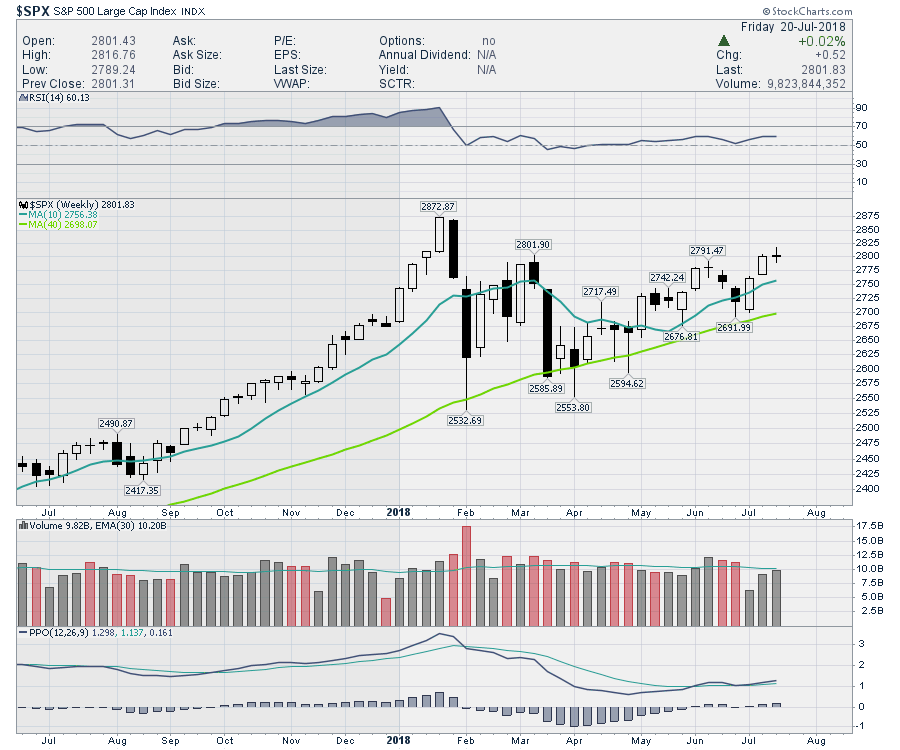
But, I am sure we are now in the bushes at the very top of the peak, unable to see what is happening if you remain in the dense shrubs and trees, and 2019 will be a down year, and start of a recession. 


So, why shouting fire in the markets now? Because, the markets are forward-looking and do not trade in the past or even current conditions. Here is a good article that encapsulates much of what I believe: 


The End is Near For the Economic Boom

 
Growth will slow. The bull market will expire. Here’s why and what you need to do about it.
July 19, 2018


"It seems a shame to pull the plug on the dance music, so we won’t, exactly. As of mid-July, forecasters were expecting the announcement of a knockout GDP growth number for the second quarter, and it wouldn’t be surprising if the U.S. economy continued to grow impressively for at least a few quarters more. Unemployment is near historic lows, and better job prospects are drawing more workers back into the labor force. No wonder business leaders are confident."

http://fortune.com/l...on-end-is-near/


#2 dTraderB

dTraderB

    Member

  • Traders-Talk User
  • 17,414 posts

Posted 21 July 2018 - 12:56 PM

A doji is a doji, a weekly doji is even more important, but dojis etc are derivatives of price  and not predictive, as far as I am concerned. Ditto for A/D line etc. 


"The US earnings season is in full bloom with major corporate earnings announcements flowing. The earnings have come out just fine, but it seems investors had already figured that out. This week the market is flat with a doji candle. What brings this doji to my attention is that it showed up while we were trying to make a convincing break above 2800.  While its too early to say the $SPX index will top out at this 2800 level again, it is an important time to stay focused as the PPO is currently just above the signal line. The big tech names will really need to improve the market momentum. The chart below highlights the options expiration dates. The blue lines represent quadruple options expirations. Shaded areas show what has happened after the last 5 options expirations during earnings season. The market behavior has been flat or down. We'll have to see if this earnings period can break the current trend. "

The Big Start To Earnings Comes Out Flat
Greg Schnell |  July 21, 2018 at 10:39 AM


15321824279001172547352.png


http://stockcharts.c...s-out-flat.html


#3 dTraderB

dTraderB

    Member

  • Traders-Talk User
  • 17,414 posts

Posted 21 July 2018 - 01:03 PM

A/D line is a derivative and post price action, hardly useful to me but others far more better seem to find it helpful. 

Of course, the A/D line will rise with rising price, DUH! And, price drops from a high with A/D high, so to say the market will not go down because the A/D line is rising is .... not useful and not exact enough to trade ST. But, IT and LT it may be useful.  


I am in agreement with the great Tom McClennan on this really good analysis, I learned from it, the "polluted" fake AD line! 


Tom McClellan: The Supposed Superiority of Common Only A-D Data
Tom McClellan |  July 20, 2018 at 08:14 AM


"As an epilogue, I should share a bit of history about how the A-D Line first came to be widely followed.  The first analysts to contemplate the meaning of the A-D data were Leonard Ayres and James Hughes, of the Cleveland Trust Company, who in 1926 decided to undertake a study of what it might mean when the A-D data do something different than what prices do.  Their early work was kept in obscurity for many years, and it was only in 1962 that the larger analytical world became aware of the utility of examining Advance-Decline data.

It was in 1962 that Richard Russell of The Dow Theory Letters, and Joe Granville of The Granville Market Letter, each separately pointed out how the NYSE’s A-D Line had shown a bearish divergence by topping in 1961, whereas the DJIA topped in early 1962.  That divergence gave warning of the 27% decline in the DJIA in 1962.  People got excited about an indicator which could give an early warning of a bear market like that, and so interest in the A-D Line grew during the 1960s.

I spoke with Richard Russell about this a few years ago, before his death in 2015, and he acknowledged that shortly after both he and Granville brought the A-D Line into the public consciousness, critics claimed it was invalid because of its supposed contamination by the behavior of utilities and insurance stocks, which were supposedly influenced by interest rates rather than the “real” stock market.  So this same dismissive argument has been around for years, but it has not diminished the usefulness of examining the A-D Line, when one does the analysis properly."

SEE HERE for complete article:

http://stockcharts.c...y-a-d-data.html


#4 dTraderB

dTraderB

    Member

  • Traders-Talk User
  • 17,414 posts

Posted 22 July 2018 - 09:56 AM

I admit I know almost nothing about GANN usage, and that is all my fault, and not GANN


Gann Angles on Dow and Gold

Gann Angles measure price moves relative to time.

The Dow is moving up the red Gann 1x1 line, so far the recent trend challenge has been over come. As price is near upper green dotted channel Gann angle from Oct 2007 price is now over bought. We can also see the very obvious Elliot 5 wave count from March 2009 lows, and a new Dow high would complete the 5 waves up. 

The red line indicator below the Dow price chart is readtheticker.com RTT Flow Index.


INDU20180721-XL.png?lastmodified=2018071

https://www.readthet...nd-gold-2018-07


#5 SemiBizz

SemiBizz

    Volume Dynamics Specialist

  • Traders-Talk User
  • 23,208 posts

Posted 22 July 2018 - 11:32 AM

Well, what we have here now is an approaching GANN 180 on the January 2018 "Episode"...


So we'll see if it inverts and flips up or if it's down we go...


I think the latter, at least into mid August, possible month-end wiggle.


zorro.gif


Price and Volume Forensics Specialist

Richard Wyckoff - "Whenever you find hope or fear warping judgment, close out your position"

Volume is the only vote that matters... the ultimate sentiment poll.

http://twitter.com/VolumeDynamics  http://parler.com/Volumedynamics

#6 dTraderB

dTraderB

    Member

  • Traders-Talk User
  • 17,414 posts

Posted 23 July 2018 - 08:44 AM

CHoppy. Indecisive, Maybe not worth trading but be warned that compression with narrow-range bars can lead to a 

blowout - up or down! 

It may not be next bar, or later today, or this week, or next week, but it will come....  natural phenomenon. 


ST SELL with stop @ SPX 2807.3


#7 qqqqtrdr

qqqqtrdr

    Member

  • Traders-Talk User
  • 3,220 posts

Posted 23 July 2018 - 11:26 AM

Looking at my tea leaves....   GDP Growth of 4% with high growth in new housing and car sales means the market is as fairly priced due to economic over the last 9 months...   My guess if car sales, home sales, gdp, wages continue to be strong there is no reason for the market to start dropping without negative economic over the long term...   Medium term, I'm not bullish or bearish, but do not see how the 4 pillars listed above can continue to be strong...   Consumer Debt increases 2X that of inflation and GDP mostly driven by student and home loans...     


#8 SemiBizz

SemiBizz

    Volume Dynamics Specialist

  • Traders-Talk User
  • 23,208 posts

Posted 23 July 2018 - 12:49 PM

Existing-home sales decreased for the third straight month in June, with declines in the South and West, and gains in the Northeast and Midwest.


Price and Volume Forensics Specialist

Richard Wyckoff - "Whenever you find hope or fear warping judgment, close out your position"

Volume is the only vote that matters... the ultimate sentiment poll.

http://twitter.com/VolumeDynamics  http://parler.com/Volumedynamics

#9 trioderob

trioderob

    Member

  • Traders-Talk User
  • 1,295 posts

Posted 23 July 2018 - 02:15 PM

crazy thing is that might not be a negative for market.


homes sales down because no inventory and high prices


that means many will not be home owners 


on the other hand,  folks are free to move - to take higher paying jobs - they are not locked into one area for life


#10 dTraderB

dTraderB

    Member

  • Traders-Talk User
  • 17,414 posts

Posted 23 July 2018 - 03:07 PM

At peak levels, there is no way else but down. 


Economy can keep performing at full or overdrive levels but cannot continue for too long.


Markets look forward to what's next.