ETF fund flows for SPY are showing this market may not even top out in my lifetime from age 60 right now. Flows were positive on an annual basis from 1995 thru 2002 increasing every year up to 16B max. And that's how a top has to form, inflows going beyond the Y2K peak even. Then there was over 30B inflows each during 2007 and 2008 for a top. How long until the inflows get back to the 30B level for a start.....not likely this year, currently at -21.4B for 2018 so far. Based on fact, the most hated bull market in history.....

SPY fund flows
Started by
LMF
, Aug 25 2018 11:52 AM
3 replies to this topic
#2

tsharp
-

- Traders-Talk User
- 1,487 posts
Member
Posted 25 August 2018 - 02:25 PM
ETF fund flows for SPY are showing this market may not even top out in my lifetime from age 60 right now. Flows were positive on an annual basis from 1995 thru 2002 increasing every year up to 16B max. And that's how a top has to form, inflows going beyond the Y2K peak even. Then there was over 30B inflows each during 2007 and 2008 for a top. How long until the inflows get back to the 30B level for a start.....not likely this year, currently at -21.4B for 2018 so far. Based on fact, the most hated bull market in history.....
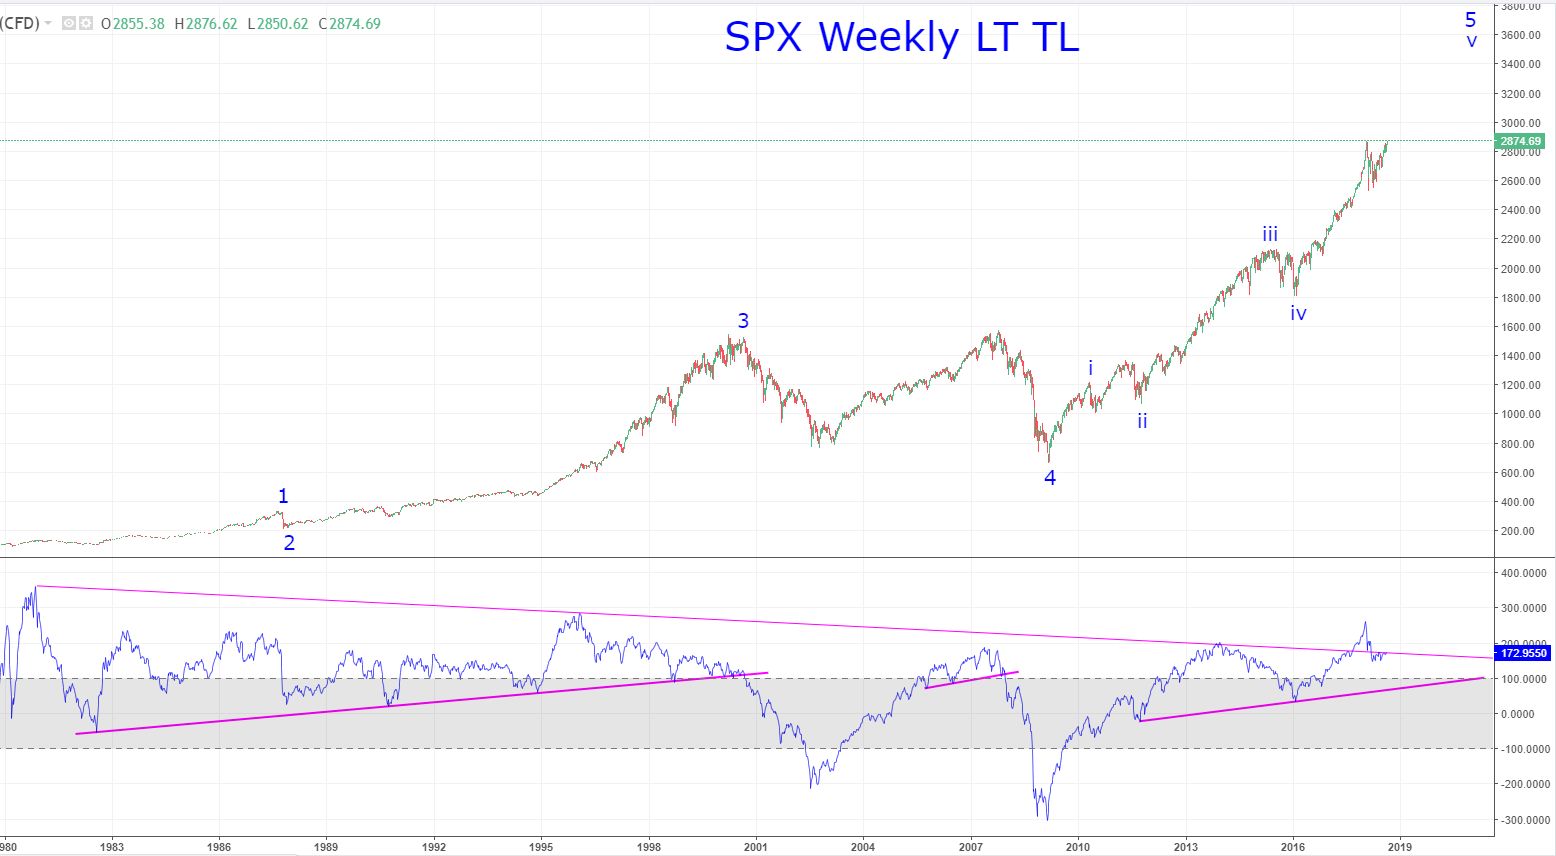
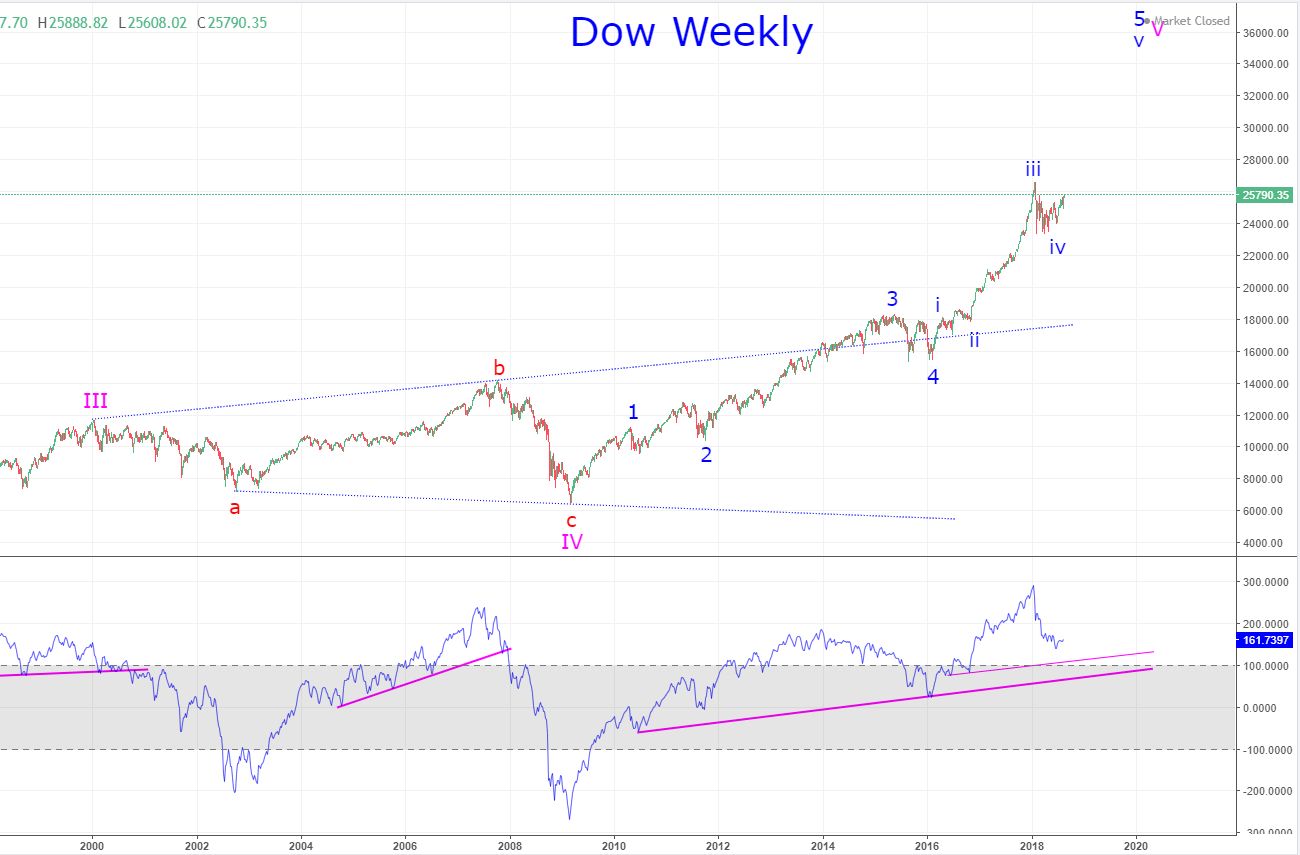
My work suggests no TL break for a couple years still in both the Dow and SPX... it will become the bluest of the Blue Chips that are the last to fall.
#3
LMF
-
- Traders-Talk User
- 801 posts
Member
Posted 26 August 2018 - 09:27 AM
Assuming the Fed doesn't royally screw things up like Bernanke in 2007......its the leverage that typically leads to a top. Chicago Fed has a nice leverage subindex plot that shows it. Not even close to anything significant yet.
#4
CLK
-

- Traders-Talk User
- 10,787 posts
Member
Posted 26 August 2018 - 10:35 AM
ETF fund flows for SPY are showing this market may not even top out in my lifetime from age 60 right now. Flows were positive on an annual basis from 1995 thru 2002 increasing every year up to 16B max. And that's how a top has to form, inflows going beyond the Y2K peak even. Then there was over 30B inflows each during 2007 and 2008 for a top. How long until the inflows get back to the 30B level for a start.....not likely this year, currently at -21.4B for 2018 so far. Based on fact, the most hated bull market in history.....
Fundamentals are sorely overlooked on this board, keep us posted.


