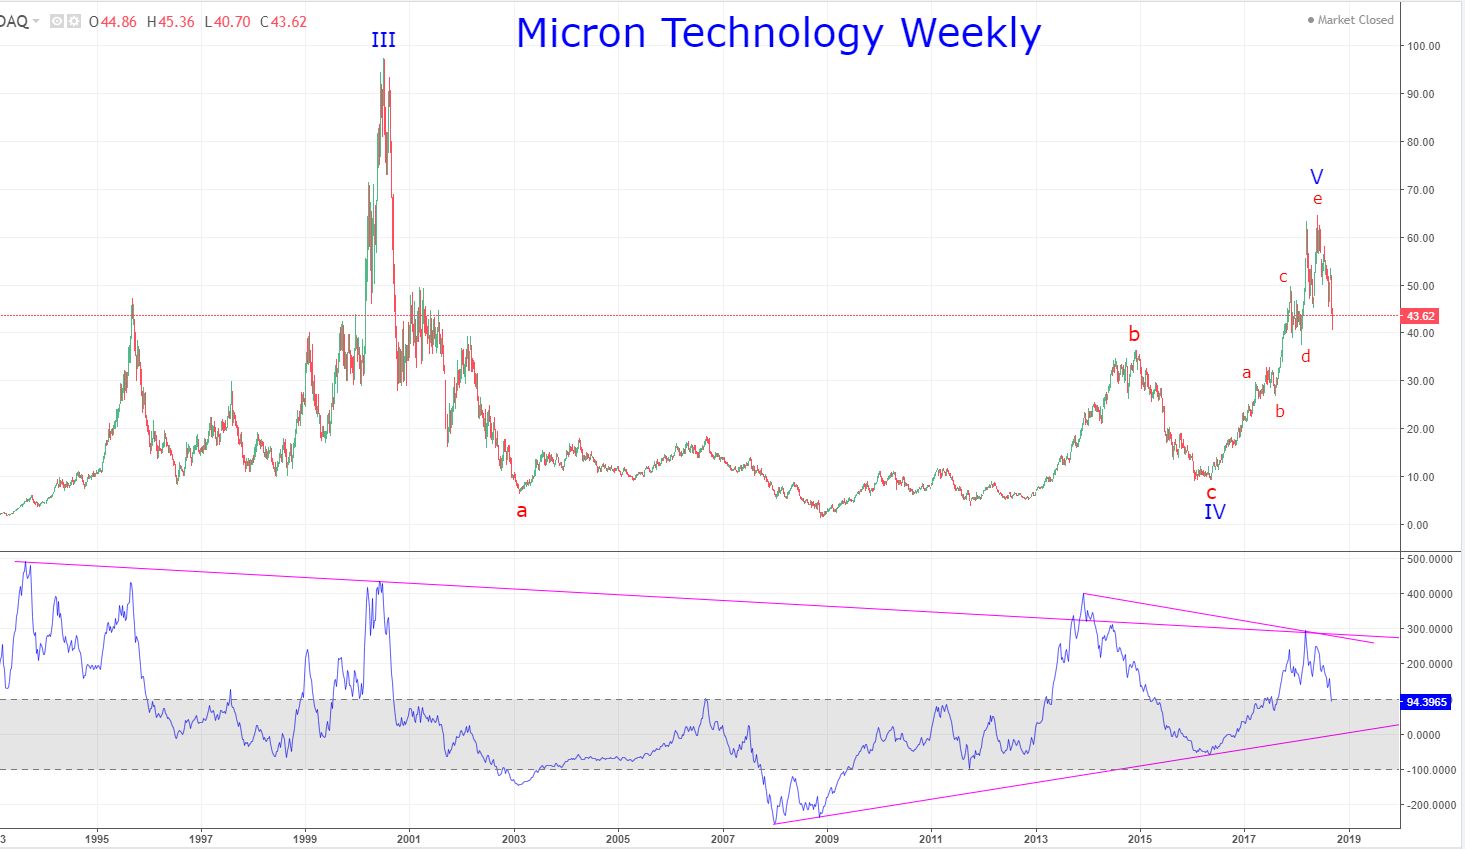
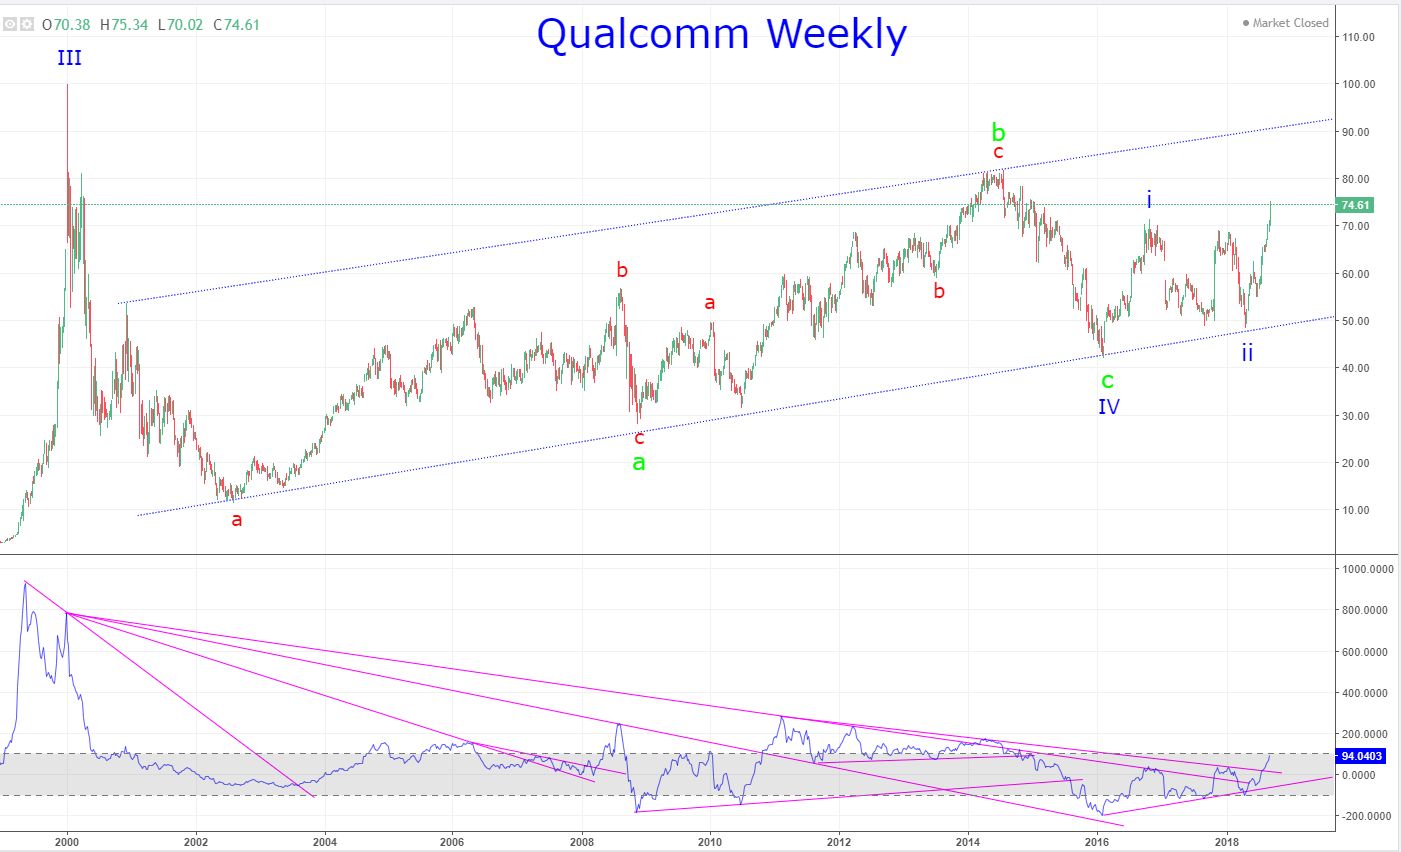
Qualcomm and Micron Technology are incredibly interesting charts, in that, they show what I've been saying for a long time, that when an asset goes parabolic in price, it typically crashes, then takes some 10-20 years to recover, if it actually does recover. These both went parabolic in price back in the Dot Com boom.
Qualcomm appears to be in a bull market with the potential to make new ATHs IF it can actually break upward through the upper channel UTL in the future:
Micron Technology does not seem to share that same future; it appears to have completed its final fifth wave in an EDT truncation, much like the CAC 40... the tell will be what it does with the 100 support level and the UTL on its momentum indicator line.