
From an IG post on 7.23.18 https://www.instagra...ehighstrategies
Parabolic rises...
I was curious about the chart of Amazon, so took a looksy.
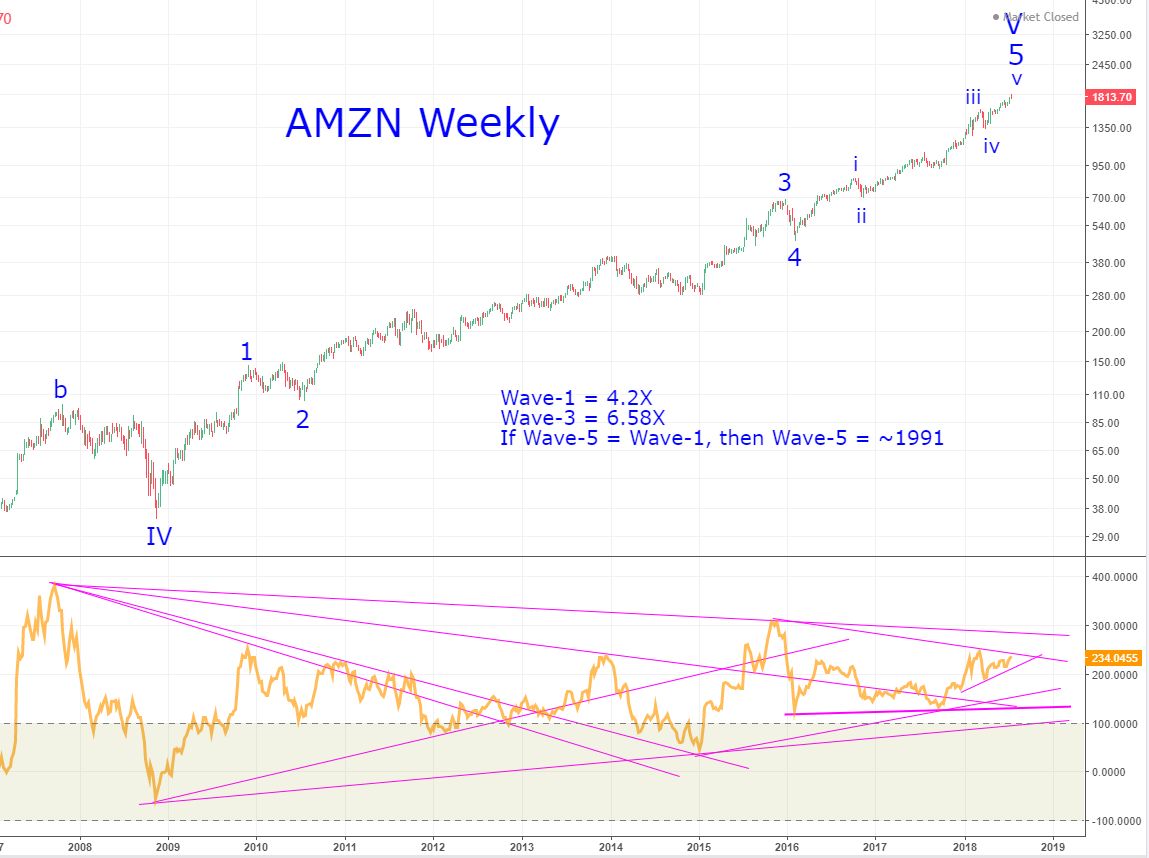
Parabolic rises in price are the most difficult to forecast... using multipliers rather than Fibonacci relationships seems to make the most sense to me... then too, there is much less historical data on the newer companies, so I also had to assume the Wave-III, along with the general market cycle.
Amazon doesn't appear to be on the verge of a change in trend, as that doesn't happen from the momentum high at which it's presently sitting.
Additionally, the projection is a perfect world relationship of wave-5 being equal to wave-1... it can extend.
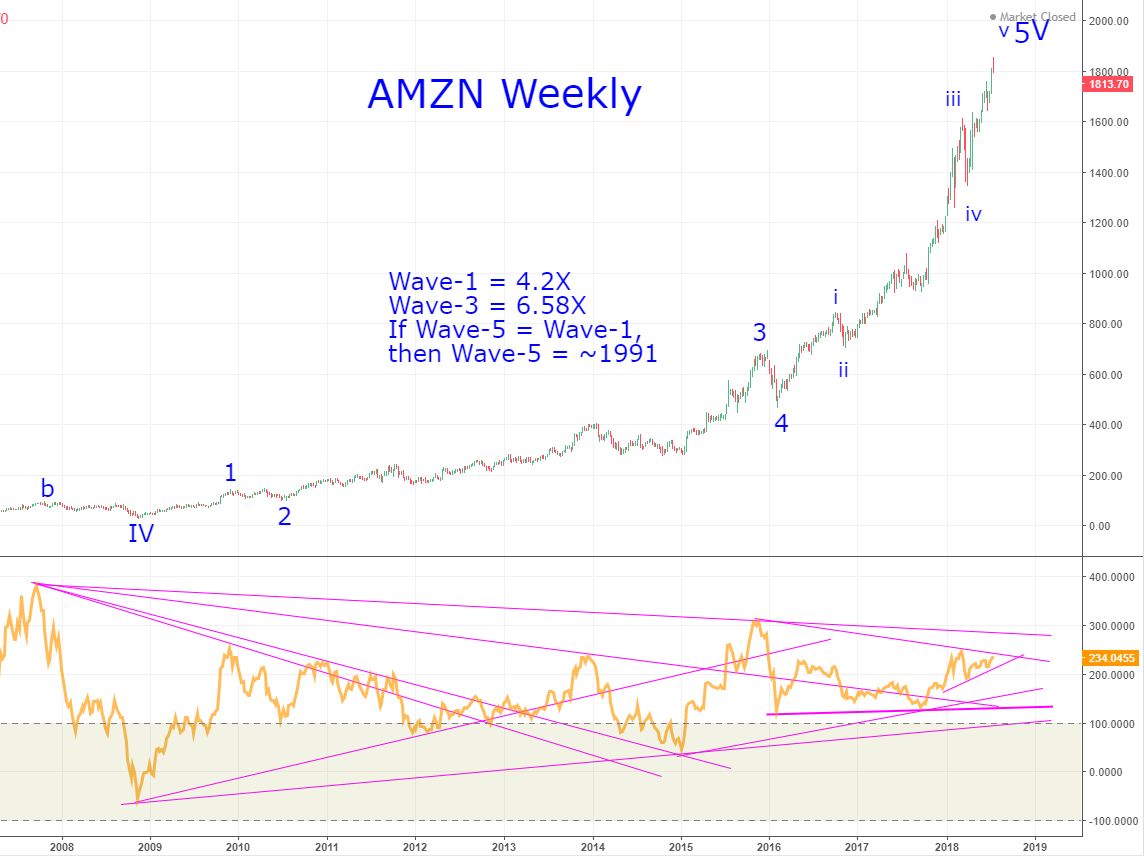
The first chart is the log scale version, and the second chart is linear scale... watching.
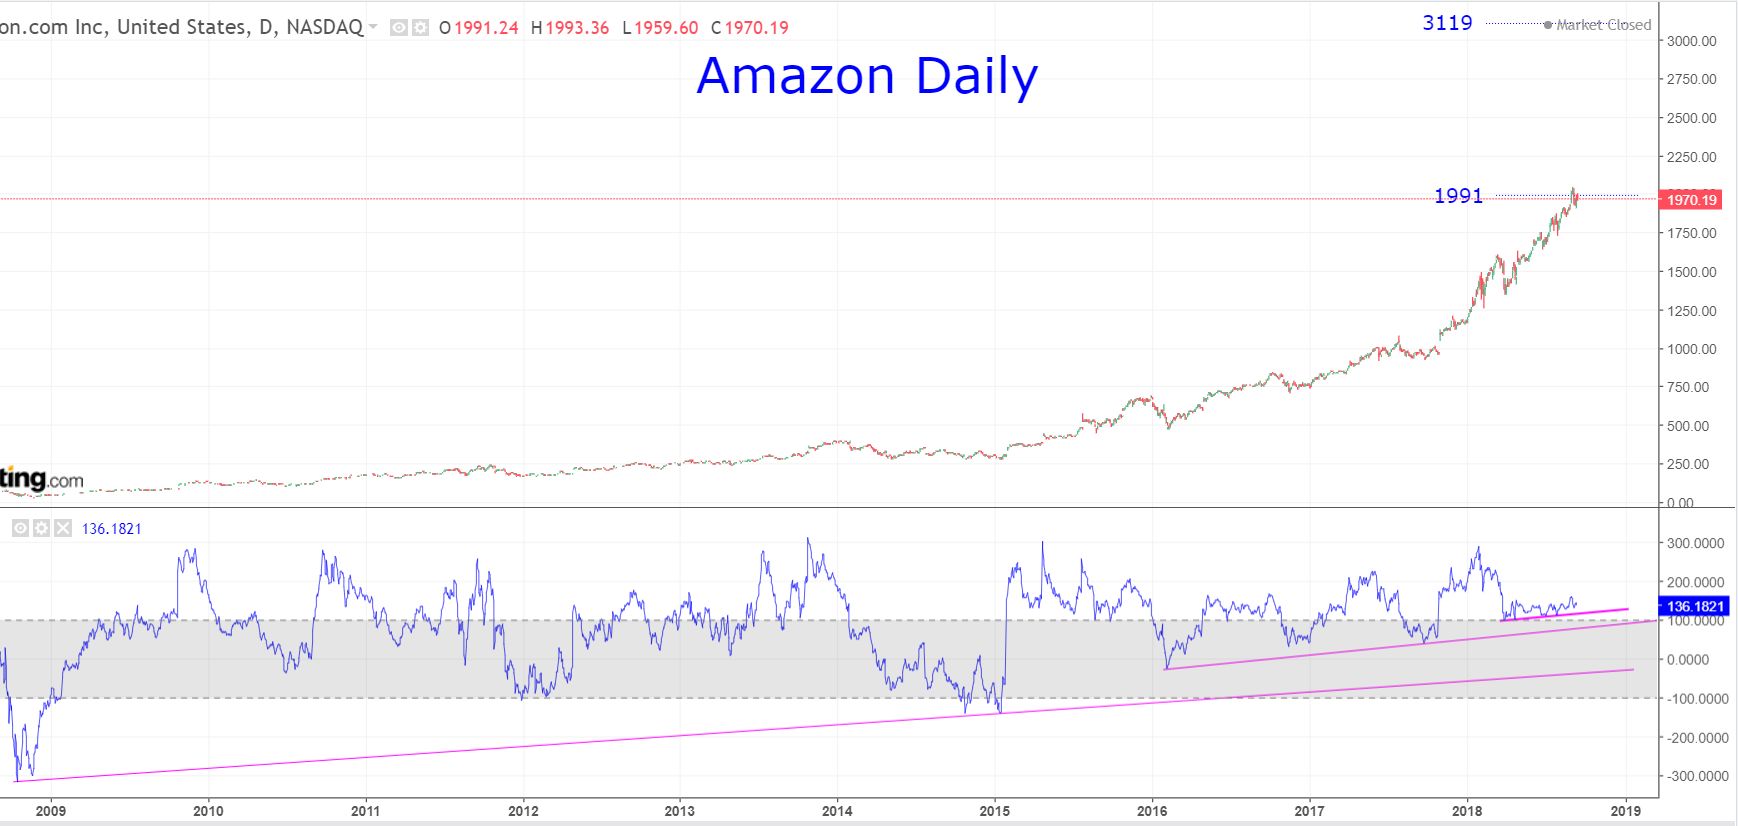
Post-script (9.15.18), since this forecast was made, the ~1991 target has been achieved with a slight throw-over, yet the momentum indicator line is not in in a position to suggest this move is complete.
This is not to say that the price won’t stall here, having achieved my target, and a pull back take place that brings the momentum indicator line downward to the UTL, then another upward move that registers a lower-high… but for now, this is purely hyperbole and speculation.
If the bull market is strong enough, the next target is quite a way up there at above the 3119 level… watching.
Edited by tsharp, 15 September 2018 - 10:06 AM.


