Jump to content


Photo

NDX


  • Please log in to reply
3 replies to this topic

#1 tsharp

tsharp

    Member

  • Traders-Talk User
  • 1,487 posts

Posted 18 September 2018 - 04:58 PM

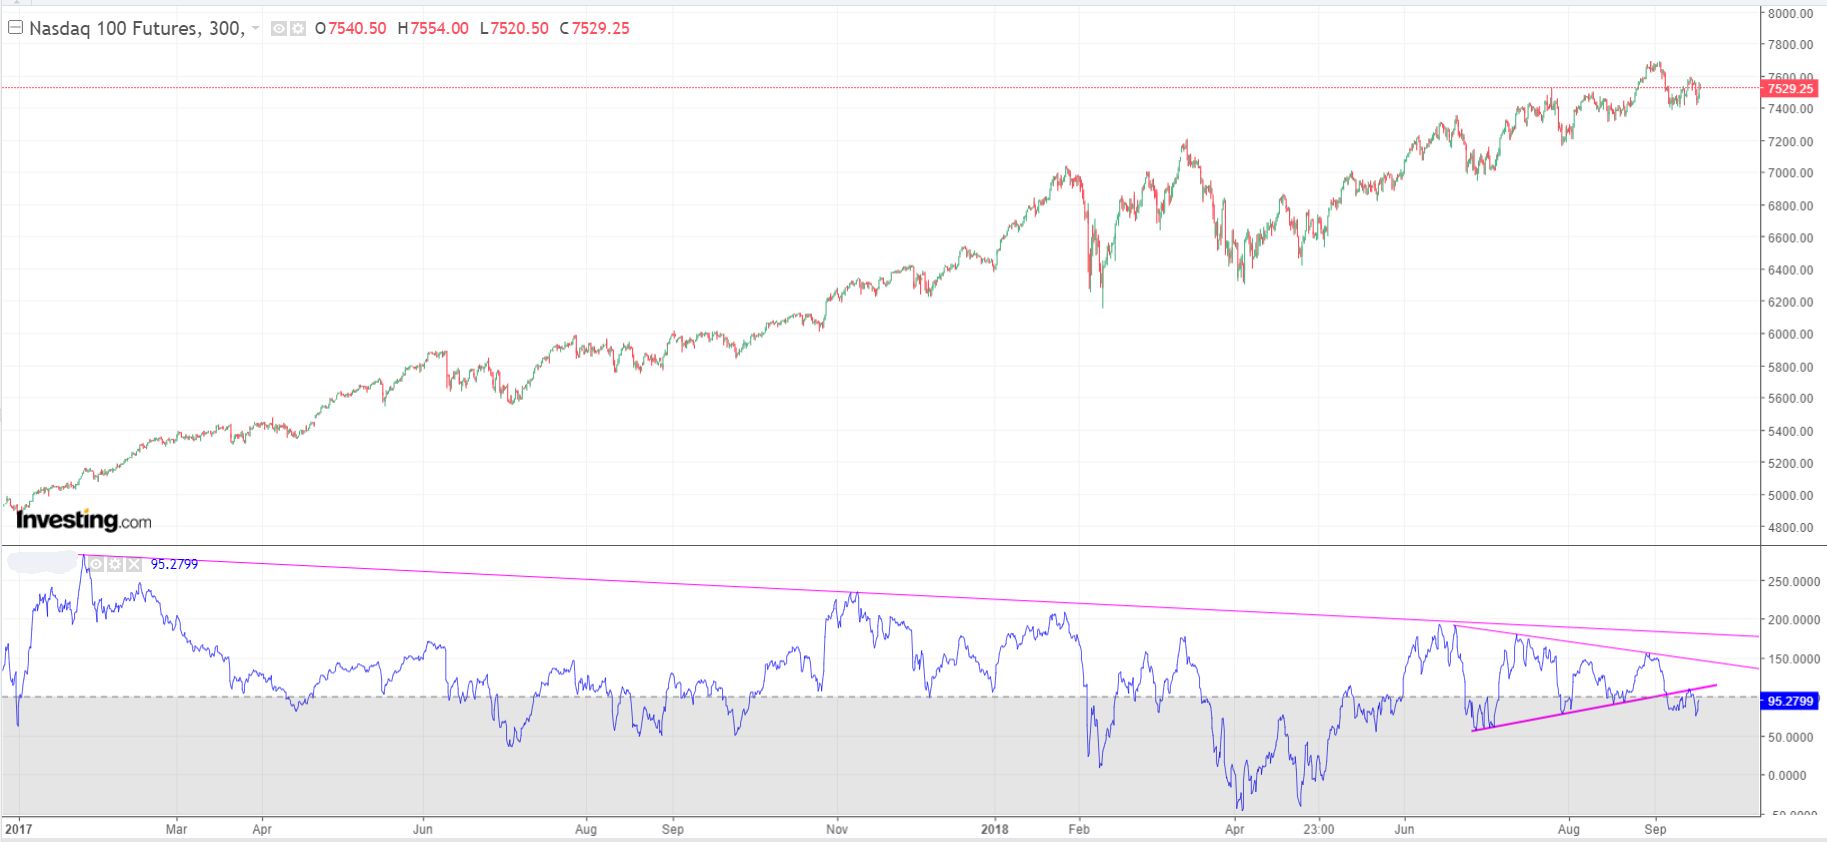
I had the NDX futures on a sell on the 300-min chart from yesterday...


If it does not resolve in the next day or two, it may be that's all there is for the NDX...


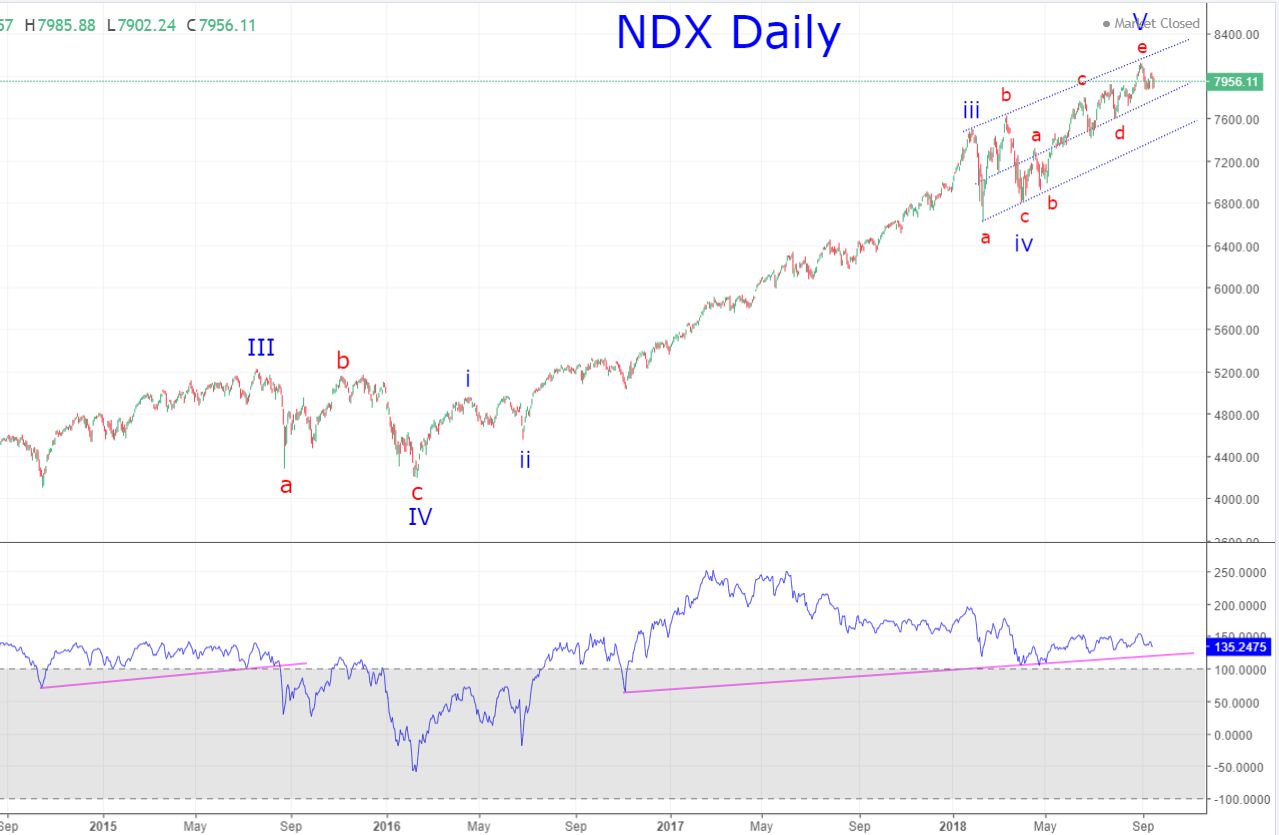
The daily NDX could also be telling the same tale, though with EDTs, sometimes the fractal interpretation can be a bit murky... watching.


ND00s_300_9.18.18.jpg


NDX_D_9.18.18.jpg


#2 tsharp

tsharp

    Member

  • Traders-Talk User
  • 1,487 posts

Posted 18 September 2018 - 05:52 PM

And what I mean above about resolving itself, is that even EDTs and extend... so that what is presently marked as wave-c, may actually become wave-a... if that's the case, then it would be likely that only wave-b is in progress at this time.


#3 LMF

LMF

    Member

  • Traders-Talk User
  • 801 posts

Posted 18 September 2018 - 10:30 PM

With the rising 200 day MA on the NDX......a significant top is still over the horizon somewhere.  I looked at the period from Labor day to Dec 31, and since 1987 it's been up 27 out of 30 years.  Incredible numbers.  The last down year was 2008 of course, and 2000 before that.  It takes some serious problems to get in the way of the NDX, problems here in the US not anywhere else on the planet.  There were 2 dark monthly candlesticks in a row, back in Feb and March......and that exact setup guaranteed a run to new all time highs.     


#4 NAV

NAV

    Member

  • Traders-Talk User
  • 16,087 posts

Posted 20 September 2018 - 12:23 AM


If it does not resolve in the next day or two, it may be that's all there is for the NDX...


When you say that maybe all, are you talking about a long term top ?


Edited by NAV, 20 September 2018 - 12:23 AM.

"It's not the knowing that is difficult, but the doing"


https://twitter.com/Trader_NAV