Jump to content


Photo

Super-critical Phase of markets in 2018


  • Please log in to reply
16 replies to this topic

#1 dTraderB

dTraderB

    Member

  • Traders-Talk User
  • 17,341 posts

Posted 28 September 2018 - 01:28 PM

Firstly, if you have not been trading crude you missed out on some great trades but you can still trade it next week. 


This is not a super-critical phase for the equity markets in 2018 and the next week will determine the trend for the rest of the year.


Market looks strong but there are widening cracks under the hood. These are not terminal since a few sessions of strong rallies will mend all that. 

However, the market is nearing a breaking point and can quickly enter that Crash Mode. The Crash Window is open. 


#2 NAV

NAV

    Member

  • Traders-Talk User
  • 16,087 posts

Posted 28 September 2018 - 02:07 PM


This is not a super-critical phase for the equity markets in 2018 and the next week will determine the trend for the rest of the year.


I agree


"It's not the knowing that is difficult, but the doing"


https://twitter.com/Trader_NAV


#3 Waver

Waver

    Member

  • Traders-Talk User
  • 802 posts

Posted 28 September 2018 - 02:25 PM

"not a super-critical phase" or "now a super-critical phase"?

Nav you agree it is not or it is now super-critical  phase?


#4 NAV

NAV

    Member

  • Traders-Talk User
  • 16,087 posts

Posted 28 September 2018 - 02:28 PM

"not a super-critical phase" or "now a super-critical phase"?

Nav you agree it is not or it is now super-critical  phase?


"now a critical phase" is more appropriate. Super is more of a hyperbole.


"It's not the knowing that is difficult, but the doing"


https://twitter.com/Trader_NAV


#5 redfoliage2

redfoliage2

    Member

  • Traders-Talk User
  • 18,022 posts

Posted 28 September 2018 - 02:43 PM

Lots of distribution today, but the market was managed to hold up for the quarter end windows dressing.


Edited by redfoliage2, 28 September 2018 - 02:52 PM.


#6 Waver

Waver

    Member

  • Traders-Talk User
  • 802 posts

Posted 28 September 2018 - 03:18 PM

Thanks

#7 dTraderB

dTraderB

    Member

  • Traders-Talk User
  • 17,341 posts

Posted 28 September 2018 - 04:05 PM

Typo in the haste to post while watching  a few chart windows....


It should be "NOW" instead of "NOT"


#8 Waver

Waver

    Member

  • Traders-Talk User
  • 802 posts

Posted 28 September 2018 - 04:19 PM

Thanks

#9 dTraderB

dTraderB

    Member

  • Traders-Talk User
  • 17,341 posts

Posted 28 September 2018 - 05:49 PM

Bank Shares Tumble as Earnings Season Nears


The S&P 500 financial sector is heading for its worst week in six months.  


Bank stocks are suffering their worst week in six months, the latest sign that investors remain cautious on the financial sector even as the U.S. economy grows at the fastest pace in years.

 The S&P 500 financials sector has fallen 3% this week, on pace for its worst period since March 23, to trim all of its 2018 gains. The decline comes after the group hit a six-month high last week. The more narrow KBW Bank index of 24 bank stocks has also struggled, lagging behind as the broader stock market has hit fresh records.

The underperformance of financial stocks after the group rose 20% in 2016 and 2017 shows that investor worries about the global economy continue to hang over the latest leg of the bull market, analysts say.

With the Federal Reserve steadily raising short-term interest rates, a flattening yield curve—the gap between yields on short- and long-term Treasurys—is still depressing bank shares. Some analysts expect a flatter curve to continue hurting financials, which borrow money short-term and lend it out at longer maturities, even if the group posts stronger-than-expected earnings when reporting season kicks off in earnest in two weeks.

Bank stocks slumped along with the 10-year U.S. Treasury yield late in Wednesday’s session after the Federal Reserve raised interest rates and stuck with projections for more gradual increases ahead. The declines rippled through the broader stock market, pushing the S&P 500 into the red for a fourth straight session.

Some analysts say the sector’s recent volatility indicates broader anxiety that a trade war will cut demand for loans, with economic weakness in industries tied to banking, such as the housing and auto markets, continuing to worry investors. Volatility in other growth-sensitive assets like commodities has been another warning sign for money managers.

“It does beg the question: What are they suggesting about where economic fundamentals are heading?” said Jim Paulsen, chief investment strategist at Leuthold Group.

Some investors remain confident in bank stocks, which are still up 5% for the quarter and trade at cheaper levels than the broader market ahead of earnings.

But after the market largely shrugged off the group’s steady second-quarter results in July, it’s worth keeping an eye on their performance as stocks head into October.

Are you worried about the dip in bank stocks? Let the author know your thoughts at amrith.ramkumar@wsj.com. Emailed comments may be edited before publication in future newsletters, and please make sure to include your name and location. 

  https://www.wsj.com/...ears-1538136000


#10 dTraderB

dTraderB

    Member

  • Traders-Talk User
  • 17,341 posts

Posted 28 September 2018 - 06:02 PM

Carl's BPI analysis


DP Weekly/Monthly Wrap: Failure to Thrive
Carl Swenlin |  September 28, 2018 at 06:52 PM


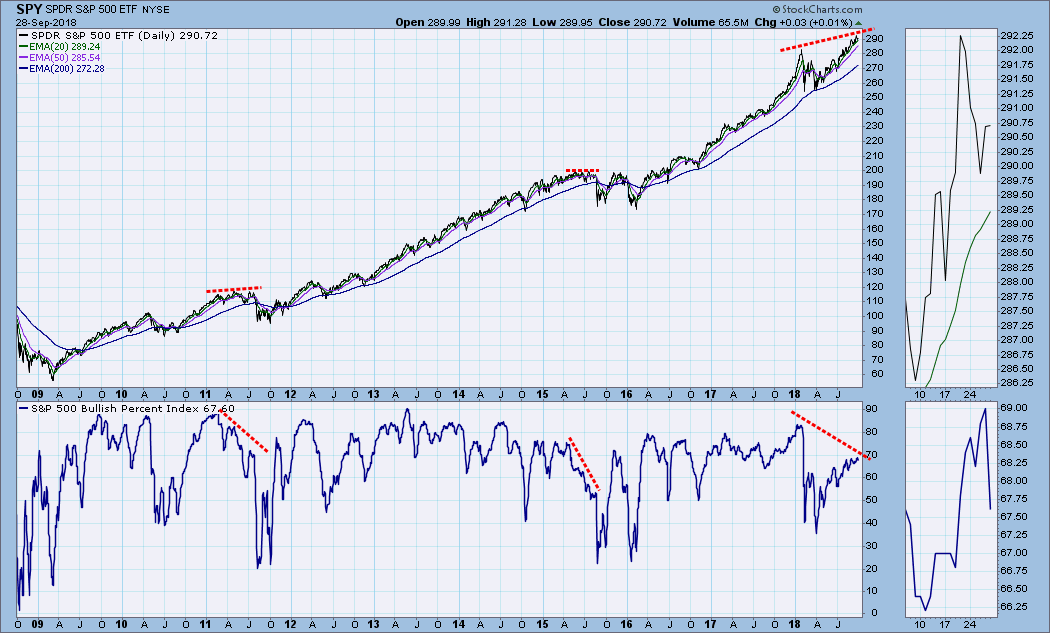
This chart was added almost as an afterthought in last Friday's DP Weekly Wrap, but throughout the week I kept thinking that it should elevated to the lead chart this week. The Bullish Percent Index (BPI) shows the percentage of S&P 500 stocks with point and figure (PnF) BUY signals. I have annotated three significant negative divergences. The first two show the BPI dropping while prices rise or remain flat. This undermining eventually results in sharp price pullbacks. The current divergence is different but still significant.  Here prices are pushing to record highs, but the BPI, struggling to reach 68, falls far short of the BPI of 83 back in January, hence, my description Failure to Thrive.

153816770475891489092.png

What the BPI is telling us is that fewer stocks are helping to push the index higher, and that the larger-cap stocks are probably doing more of the work. As I said last week, this may not be of immediate concern -- the BPI was at about 60 at the 2000 market highs -- but there is enough of a divergence to discourage complacency in the face of a seemingly bulletproof market.

See more here:
https://stockcharts....-to-thrive.html