More later.

In the Danger Zone, Crash Window wide open
Started by
dTraderB
, Oct 15 2018 03:13 PM
8 replies to this topic
#2

dTraderB
-
- Traders-Talk User
- 17,200 posts
Member
Posted 15 October 2018 - 05:46 PM
When market volatility ($VIX) explodes to the upside, the market trades much more on emotion than it does on technical conditions. Panic sets in and buyers go on strike until the market begins to settle down. Bounces do begin to offer encouragement as market makers finally begin to do what they're supposed to do, which is to provide liquidity during periods when there is a selling imbalance. Until bounces begin to occur, you have to be very, very careful and avoid buying and essentially stepping in front of that freight train. Let's take a look at the last two significant bouts of high volatility (panicked selling). First let's look at January-February 2018 on a 60 minute chart:
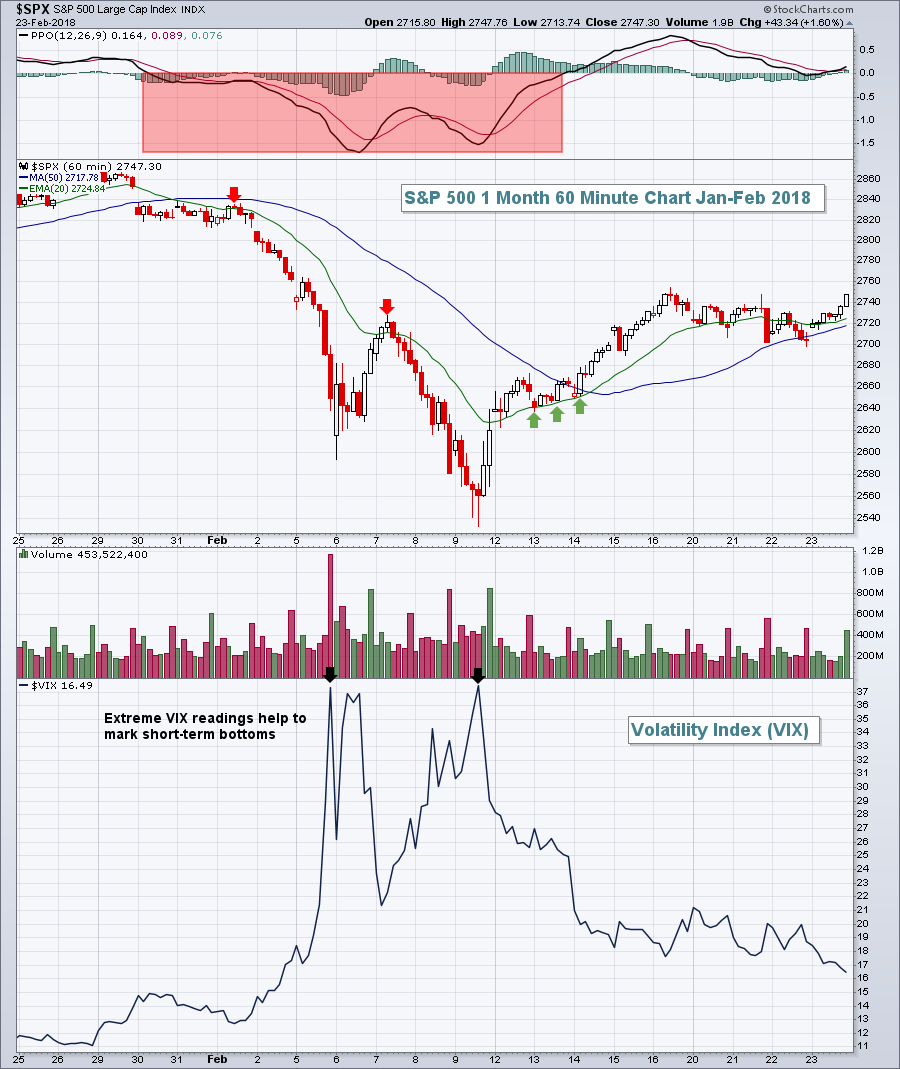 An hourly PPO below zero is problematic during short-term, high volatility periods. Bounces are welcome relief, but typically lead to more short-term selling. A similar selling episode occurred in March-April 2018:
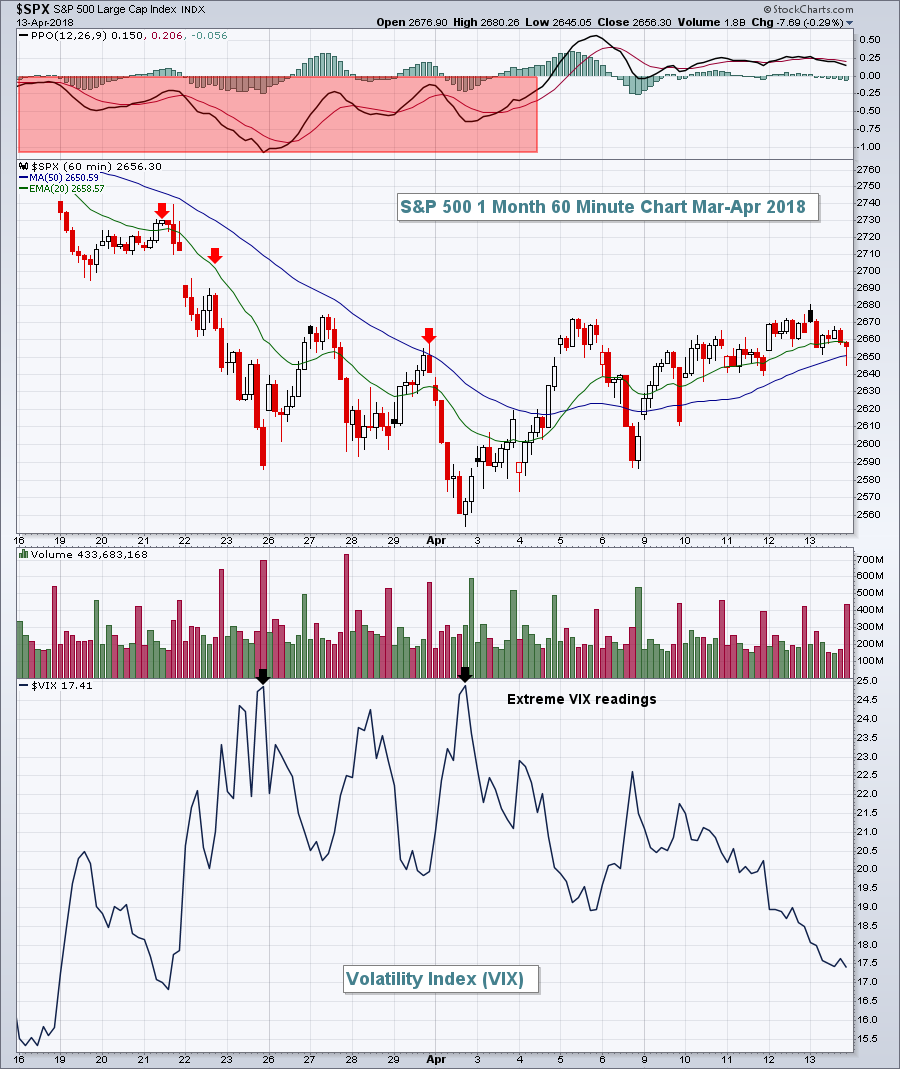 In both of these cases, the S&P 500 didn't begin to trend higher again until the 50 hour SMA and PPO centerline resistance were both cleared. Trying to call bottoms before this combination occurs can be quite dangerous. Let's look at where we stand to start this week:
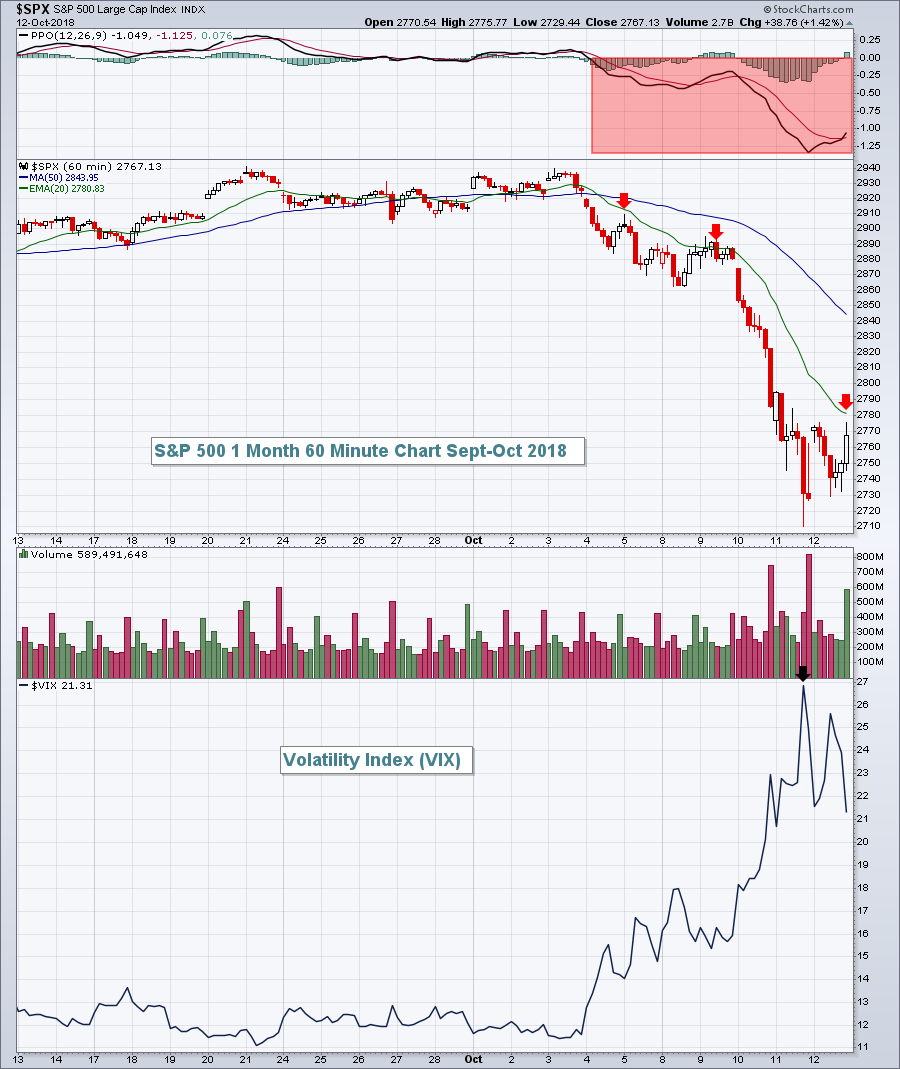 Based upon how the other highly volatile periods played out, it looks to me like it's too early to try to call a bottom from last week. If earlier periods in 2018 are any indication, we should look for at least a test of last week's lows, if not a further move lower. The very first thing that needs to happen from a bullish perspective is to clear the declining 20 hour EMA. No bounces should be construed as bullish until this first step is accomplished. Then we can move on to 50 day SMA and PPO centerline tests.
Stay cautious in the near-term.
https://stockcharts....ming-clues.html
#3
dTraderB
-
- Traders-Talk User
- 17,200 posts
Member
Posted 15 October 2018 - 05:53 PM
A very bearish close, look at the hourly SPX chart below. The last hour erased all the hard work the bulls had put in earlier and now there are
many dip-buyers who are under the water. The hourly shows the many attempts to break out above SPX 2770
ST short exit stop @ 2772
IT short exit stop @ 2791

#4
dTraderB
-
- Traders-Talk User
- 17,200 posts
Member
Posted 15 October 2018 - 05:54 PM
Blue line in above chart is VIX hourly
Ignore the other lines,
#5
dTraderB
-
- Traders-Talk User
- 17,200 posts
Member
Posted 15 October 2018 - 06:00 PM
The only bullish observation from this daily SPX chart is there were 2 higher lows, today and on Friday.
Market closed near the lows and below the popular 200ma, I think it is worthless but watch it because the entire trading universe does, and since I canot trad with myself but with others then I must also watch the reaction near the 200 and 50ma.
Basically, SPX has to close on a daily basis above the highs made today and on Friday.
QUIZ: when last did the 200ma daily SPX slope down? It has been sloping up for an eternity but look at it now.....

Edited by dTraderB, 15 October 2018 - 06:03 PM.
#6
dTraderB
-
- Traders-Talk User
- 17,200 posts
Member
Posted 16 October 2018 - 08:55 AM
good rally, be careful of any sudden downdrafts
#7
PrintFaster
-

- Traders-Talk User
- 1,683 posts
Member
Posted 16 October 2018 - 09:04 AM
Biggest, fastest, steepest crash in NYSI since 2011.
Way oversold, looking at AMAT for an countertrend bounce.
Edited by PrintFaster, 16 October 2018 - 09:06 AM.
#8
redfoliage2
-

- Traders-Talk User
- 18,001 posts
Member
Posted 16 October 2018 - 09:39 AM
I see the gap may be filled at some point today..............
#9
dTraderB
-
- Traders-Talk User
- 17,200 posts
Member
Posted 16 October 2018 - 06:09 PM
What a glorious day!
Had only 11 NQ daytrades - 9 long, 2 short, 9 winners, almost straight up after 10:30am
Resisted purchasing QQQ puts until the last hour when I bought 6, reluctantly, but with QQQ up by 5 points (a rare feat!) I felt the market was extended and the probabilities were on my side.
Two VXX short trades early in the session
Well, the market broke above the key resistance level at SPX 2770 (see mail above) and then quickly went through all minor resistances, vaulted over SPX 2802, and finished just above it.
Very strong and convincing rally but ..... we got to look for at least another 30 to 40 SPX points, consolidate, and then observe the market's behavior.
For now, it's up!


