Jump to content


Photo

Breakout or Fakeout? Carl think it's the latter


  • Please log in to reply
21 replies to this topic

#1 dTraderB

dTraderB

    Member

  • Traders-Talk User
  • 17,212 posts

Posted 10 November 2018 - 06:24 PM

DP Weekly Wrap: Break or Fake?
Carl Swenlin |  November 09, 2018 at 05:38 PM


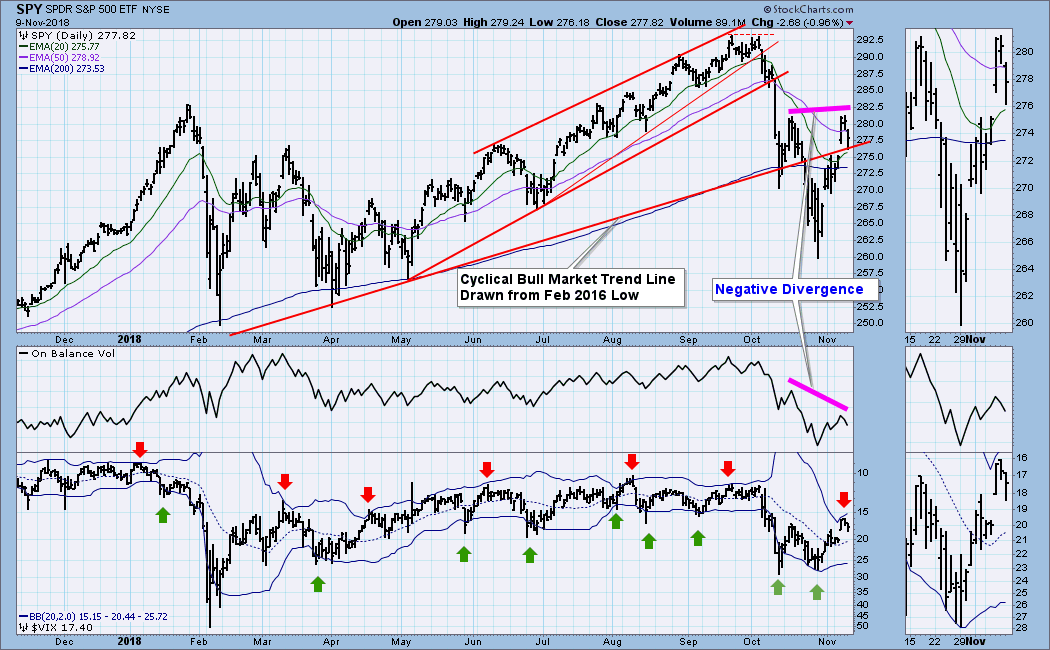
Last week SPY was below the cyclical bull market rising trend line. This week there was a post-election pop on Wednesday that caused SPY to recapture that rising trend line. Will that breakout hold, or is it a fakeout? There are two features on the daily chart that say to me that the latter is the case. First, the OBV line has formed a negative divergence, and, second, the VIX has topped at the top Bollinger Band, an event that in the last year has usually signaled a price top. At this point I'll be looking for a second trend line failure and lower prices.

15417987495111293000293.png

The DecisionPoint Weekly Wrap presents an end-of-week assessment of the trend and condition of the stock market (S&P 500), the U.S. Dollar, Gold, Crude Oil, and Bonds.


https://stockcharts....ak-or-fake.html


#2 dTraderB

dTraderB

    Member

  • Traders-Talk User
  • 17,212 posts

Posted 11 November 2018 - 07:54 AM

Current Outlook

I mentioned during MarketWatchers LIVE yesterday that the bears were on the defensive as the S&P 500 had climbed to a very significant price resistance level and had done so just as short-term price relative breakdowns were occurring in a few key defensive areas.  If the S&P 500 could clear the 2817 area with money rotating to aggressive areas of the market, in my opinion, a lot more technical buyers would appear.  Fortunately for the bears, they provided resistance and won the short-term battle yesterday afternoon.  Here's a 3 month 60 minute chart that's worth keeping an eye on:

1541770853138193462212.pngThe intraday price to watch on the S&P 500 is 2816.94 and the closing price is 2813.89.  Keeping an eye on the above sector relative charts would be a good idea as well.  If the S&P 500 pulls back further, but we don't really see much outperformance by defensive sectors, that could be a very important signal that the weakness won't last.


#3 dTraderB

dTraderB

    Member

  • Traders-Talk User
  • 17,212 posts

Posted 11 November 2018 - 07:56 AM

McClellanOsc_414.gif


https://www.mcoscill...t_breadth_data/


#4 dTraderB

dTraderB

    Member

  • Traders-Talk User
  • 17,212 posts

Posted 11 November 2018 - 07:57 AM

https://money.cnn.co...fear-and-greed/


#5 dTraderB

dTraderB

    Member

  • Traders-Talk User
  • 17,212 posts

Posted 11 November 2018 - 07:57 AM

https://www.nasdaq.c...ons/isee-index/


#6 dTraderB

dTraderB

    Member

  • Traders-Talk User
  • 17,212 posts

Posted 11 November 2018 - 08:05 AM

....Which brings me to the bearish case: If bulls can’t recapture this trend line they risk falling hard off of this trend line and face a possible retest of lows (which could spark a “W” bottom) or new lows.

The new low scenario could very consequential for several reasons. Firstly, as you see in the chart above the recent correction has not even retraced to the larger fib levels since the 2016 bottom. The nearest major fib level is at 2508 on $SPX which would bring us to new lows for the year. If this market resolves bearishly that level may or may not get hit in 2018, but it’s possible.

But a bearish resolution could certainly open markets up to this lower risk zone:


.........So one may argue bears are running out of time to prove their case and the next 2 weeks may prove critical.

Which brings me to a potentially very bullish scenario.

Firstly recognize that Friday’s reversal made perfect technical sense. I had already outlined the 2016 trend line as a natural point of resistance. But it was more than that.

Note the counter rally was so steep (over 8% on $SPX) by Thursday night $NYMO had reached its most overbought reading in almost 3 years:

https://northmantrad...e-battle-lines/


#7 dTraderB

dTraderB

    Member

  • Traders-Talk User
  • 17,212 posts

Posted 11 November 2018 - 09:13 AM

As the Fed sticks to the script, you should bear in mind that the overarching narrative is still one where conditions are getting tighter.

“Even with the +8.3% rally off last week’s lows to yesterday’s SPX highs, DO NOT be mistaken — we remain immersed within the ‘financial conditions tightening tantrum’ end-of-cycle phase,” Nomura's Charlie McElligott wrote on Friday, adding that “U.S. 5Y real yields sit at highs since early 2009, corporate credit Baa-10Y yield spread is 45 bps wider off early February levels and the 90-day commercial paper-3M T-Bill spread has nearly tripled to +27 bps since early September levels.” Here's a visual on that:


47439673-15418666355293825.png(Bloomberg)

In case it's not clear enough, my message to readers is that if you're inclined to chase the market higher into year-end, you should be apprised that while the conditions may be in place for a squeeze to the upside, the fundamental backdrop remains the same. Conditions are getting tighter, global growth looks to be decelerating and tech continues to look vulnerable.

All three of those factors are cause for concern, if not in the very near-term, certainly at the turn of the calendar year.


#8 dTraderB

dTraderB

    Member

  • Traders-Talk User
  • 17,212 posts

Posted 11 November 2018 - 09:15 AM

Actions To Take Next Week

The failed rally on Wednesday continues to suggest the broader market complex remains substantially weak for now. This keeps our portfolio management practices more focused on capital preservation currently rather than trying to capture short-term gains.

As noted we have already taken the following actions:

  1. Reduced overall portfolio exposures to 50/50 from 60/40.Allocations will be reduced further upon increased technical deterioration.

  2. Rebalanced bond exposures and reduced risk. We improved credit quality and are positioning for economic weakness and lower yields by managing durations(Read: The Upcoming Bond Bull Market)

  3. Raised cash levels to 10%. (Cash is a risk-free portfolio hedge.)

  4. Reviewed all positions. We sold several positions which were underperforming the broader market to reduce portfolio drag.

  5. Planned for further hedges to portfolios. (Short-term Treasuries, cash, and short positions on breaks of support.)

  6. Drastically tightened up stop losses. (We had previously given stop losses a bit of leeway as long as the bull market trend was intact. Such is no longer the case.)


We are reviewing our bond allocations further to set portfolios in the right position for a sharp reversal in rates.

We are also looking opportunities in other distressed areas of the market which may provide a both a "safe haven"against further market declines and also an opportunity for capital appreciation.

https://seekingalpha...-weighs-outlook


#9 flyers&divers

flyers&divers

    Member

  • TT Patron+
  • 1,106 posts

Posted 11 November 2018 - 10:05 AM

https://theotrade.co...elling-was-over


Don Kaufman of TheoTrade always has interesting insights from the point of view of the quant options trader/strategist.

There are many aspects of price movement I do not know about or understand and he often comes up with gems.

This time his ideas seem to mesh with Swenlin's and that gets scary if one was a bull.


Trade well,

F&D


"Successful trading is more about Sun Tzu then Elliott." F&D

#10 Data

Data

    Member

  • Validating
  • 2,618 posts

Posted 11 November 2018 - 11:44 AM

Aside from a minor breach for a day, the bottom trendline held as did the NYSE at the February lows.  It has to be drawn across the February and March lows.   There is no contact of the line in April, and one would not expect the first attempt at breaking the line in 6 months would be successful.