Our preferred outlook called for a S&P 500 rally towards 2,900, followed by the next leg lower. The S&P, however, only rallied to the minimum target (2,812) and reversed rather violently. Does this mean the next leg lower is under way?
This is a short-term S&P 500 outlook. A longer-term S&P 500 outlook is available here.
Below is a close-up look at the long-term forward projection in the October 21 Profit Radar Report and here. The original projection (in yellow) is drawn on a daily chart (instead of weekly) to show more short-term detail.
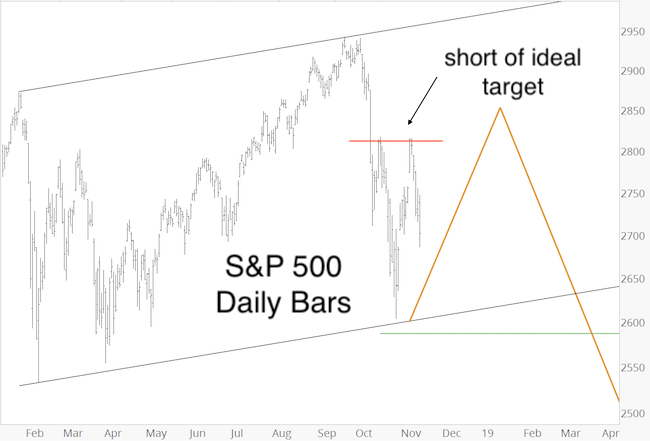
As expected, the S&P rallied from 2,600. Although this rally met the minimum requirement (61.8% Fibonacci retracement at 2,812), it fell short of the ideal target at 2,830 - 2,850 (or higher).
When price fails the reach the ideal target (in this case 2,830 - 2,850+) at the first attempt, it often reserves the right to do so on a second attempt. On the other hand, the decline from the November 7 low has the 'right look' for the projected decline.
Up or Down?
The second chart shows some additional support/resistance levels. At yesterday's low, the S&P closed the open chart gap at 2,685, which also coincided with the 61.8% Fibonacci retracement level.
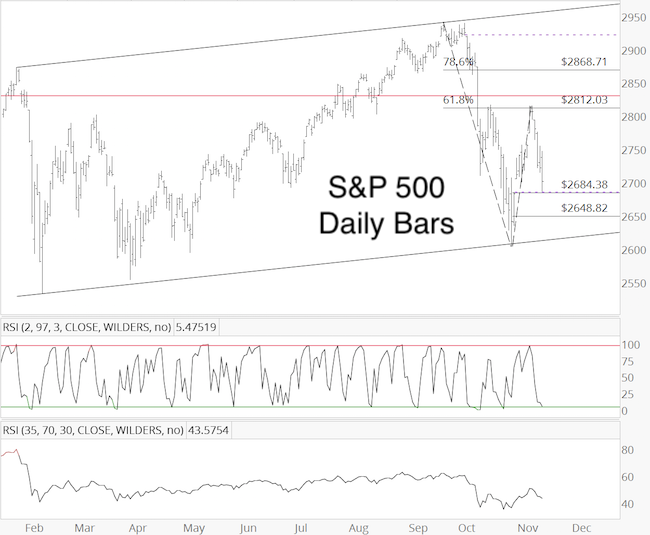
It’s tough to pick a key level inside a multi-week trading range, and the S&P could trace out a variety of complex unpredictable patterns. For now though, we may be able to keep things simple by using the 2,685 level.
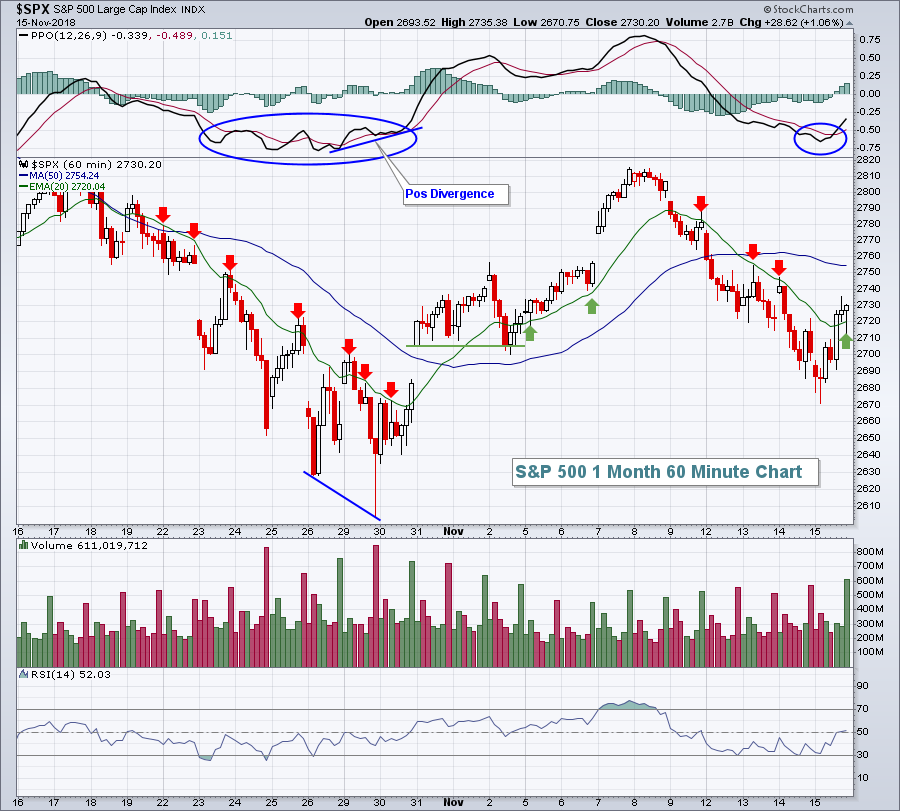
As long as the S&P stays above 2,685 (or quickly recovers after another brief wave 5 dip below), it may still move higher to reach the ideal up side target (2,830 - 2,850+). A move above yesterday's high (2,747) is needed to further increase the odds of continued gains.
https://www.ispyetf.com