TA, Fundamentals, and History support a bullish move during the next few sessions BUT
POLITICS, probe, Trade war, Europe etc can erase all of the above. Rumors flying all over about
Friday announcements and Saturday massacres.
Skittish market....
History Supports Bullish Move But Earnings Last Night Could Dampen Bulls' Victory Thursday
Current Outlook
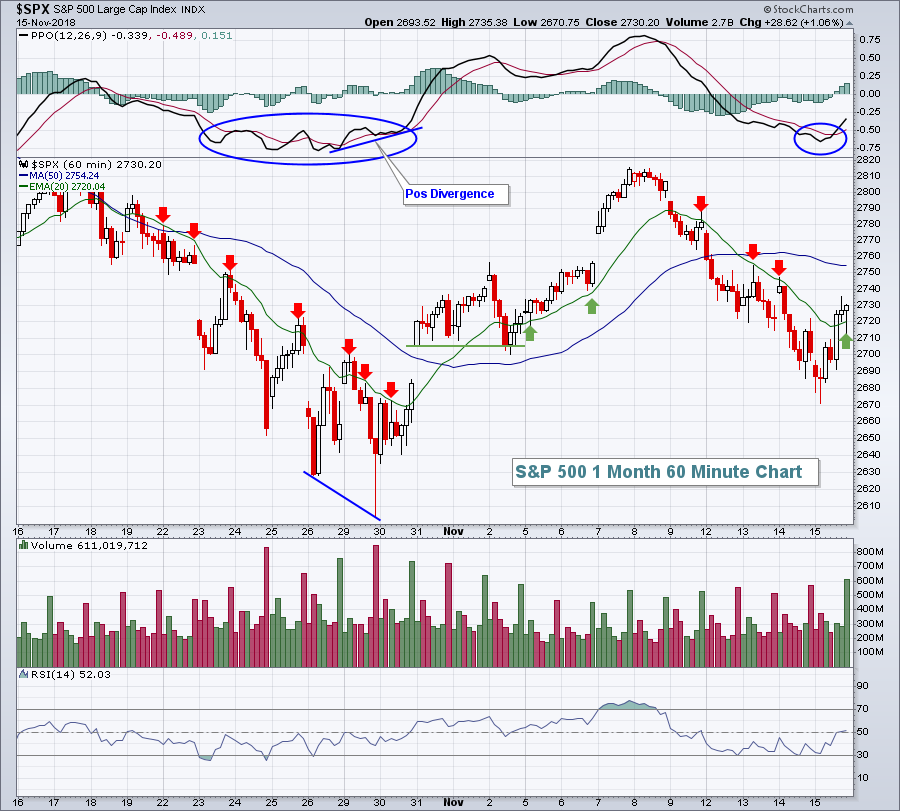
The near-term downtrend on the S&P 500 was ended yesterday during the afternoon buying spree, or was it? Recently, I've provided charts showing that the declining 20 hour EMA has provided overhead resistance on bounces. Well, that changed yesterday as price surged above both the 20 hour and 50 hour moving averages. Furthermore, when selling kicked in, the now-rising 20 hour EMA held as support:
But the October selloff ended with a much more predictable pattern as momentum slowed (positive divergence printed) as we neared a bottom. There was no such pattern yesterday. We filled gap support down to the October 30th close and then the buying began - all with the PPO accelerating lower. Is this just a blip to the upside within a bigger picture of selling? Today will likely provide us some clues. Futures are weak on the heels of several ugly quarterly earnings reports from high profile technology names like NVIDIA (NVDA) and Applied Materials (AMAT). Semiconductors ($DJUSSC) provided technology and the overall market a big lift on Thursday, but are likely to be under considerable pressure today given those two earnings reports.
https://stockcharts....y-thursday.html
Interesting that Bowley does not take into account the divergences of the MACD histogram. In my experience (which is also referenced in his chart) trendline breaks derived from divergences shown by the histogram can lead to very sharp, often lasting, moves. These moves are difficult to enter for people who do not like to trade trendline breakouts.
I remember some years ago while trading DAX futures that a poster on another board named Red Baron traded exclusively and successfully MACD histogram divergence patterns.
Regards,
F&D


