
Every bar, every tick, every day is critical but some more so than others, and Friday's fading bullish momentum opens a path for more downside action unless the previous daily swing high at SPX 2747/50 can be taken out in the next session or two. Just above that is the well-watched but insignificant 200ma.
A daily close above these two important levels is absolutely necessary to maintain the bullish momentum and the next important target @ SPX 2805.
In the current over-heated global political environment, it is not only TA or FA that determines the market direction. Talk of talks about trade war, probes, geopolitical events etc are affecting the markets. Nothing new, but also important.
Many bearish scenarios are emerging so here is a cautiously bullish one:
S&P 500 Weekly Update: The Fate Of This Bull Market Will Be Decided On How The Many Uncertainties Are Resolved
The Technical PictureThe consensus view from technicians now is that there HAS to be a blow-off, capitulation event to ensure that the lows are in. Some say that it also HAS to take place in and around the February lows of 2,532. Perhaps the consensus view will be correct in their forecasts.
One thing I have learned, markets rarely do what we want or expect. We didn't experience any of that in the February sell-off, and we didn't see that in the 2015 and 2016 declines that scared everyone to death. All three shared the same price action. A low established, a retest of that low, followed by a recovery. To date, the retest in this corrective phase has produced a low of 2,670.
The DAILY chart shows the downward pressure on equities continues. It sure looks like more downside may be in store, based on the fact that all indicators that I use do not indicate an extremely oversold condition. In fact we entered the week in "neutral" and are still in that condition.
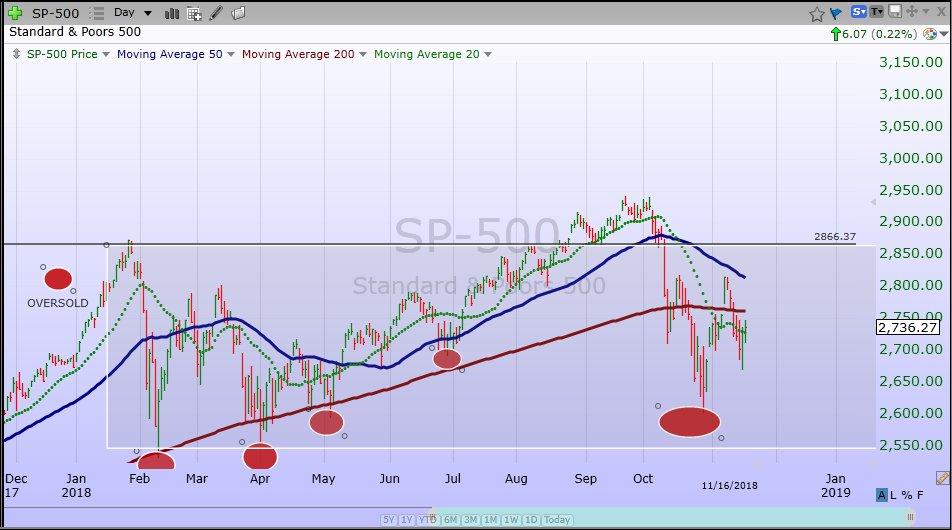
Chart courtesy of FreeStocksCharts.com
A common characteristic of Bull markets is that equities often find support at upward sloping 200-day moving averages, while a common Bear market trend is that equities run into resistance at their downward sloping 200-day moving averages. As you can see, the index is once again below that trend line (red line). Note the difference between the corrective phase back in April compared to the present day. Back then we saw a quick dip below the 200-day MA, not so today.
From a technical perspective, our current situation looks like the 2015/2016 time period. In early 2016, the S&P remained below that trend line for about 11 straight weeks before recovering.
As noted earlier, the S&P traded down to the 2,670 level, and that set a new short-term line in the sand that must be held, or the S&P lows (2,603) may be tested. On the flip side, more sideways consolidation in this area, and the index could mount a run back to the 2,800 level. The Bulls would like to see a series of higher lows as the bottoming process unfolds.
Overhead resistance lies at the 200-day moving average at 2,760.
The Political SceneAs we all look out to the next quarter, market pessimism has been fueled by tariff fears and concerns about global economic growth. Yet, analysts are seeing 8% U.S. gains for both exports and imports in 2018 that are the largest increases since 2011. The oil related sector and broader factory boom of 2017-18 explains part of the bounce, though analysts have seen broader strength across the industrial supply, equipment, and food components.
Stay tuned. Any announcement from the G20 summit meeting on this topic will be a market-moving event.
https://seekingalpha...inties-resolved


