Jump to content


Photo

SAVED, AGAIN! The Bull lives ...


  • Please log in to reply
28 replies to this topic

#1 dTraderB

dTraderB

    Member

  • Traders-Talk User
  • 17,279 posts

Posted 01 December 2018 - 09:58 AM

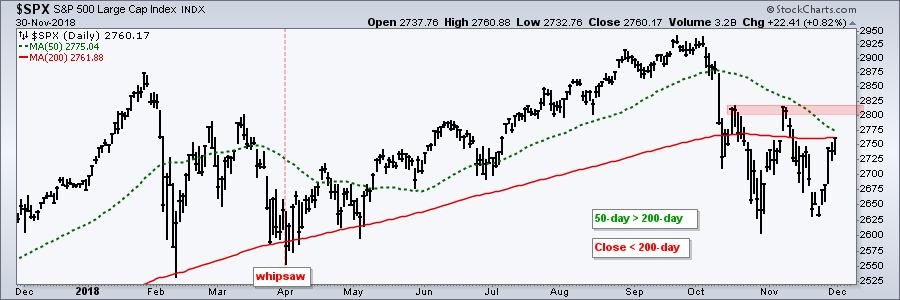
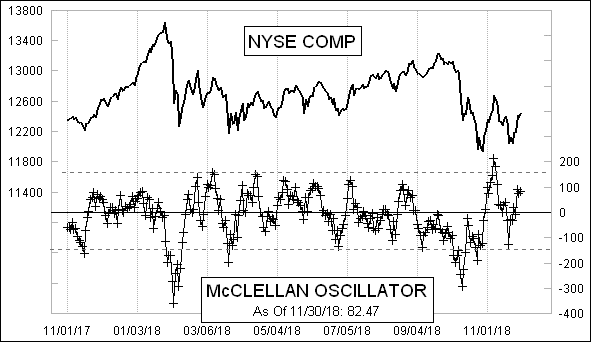
Actually, I don't think the BULL is fully energized as it was in 2017 and earlier this year. It is still in ICU and needs 

more strength if it can rally in December. 

Here's one opinion on the Cavalry riding to rescue the Bull when it was on the verge of collapse:


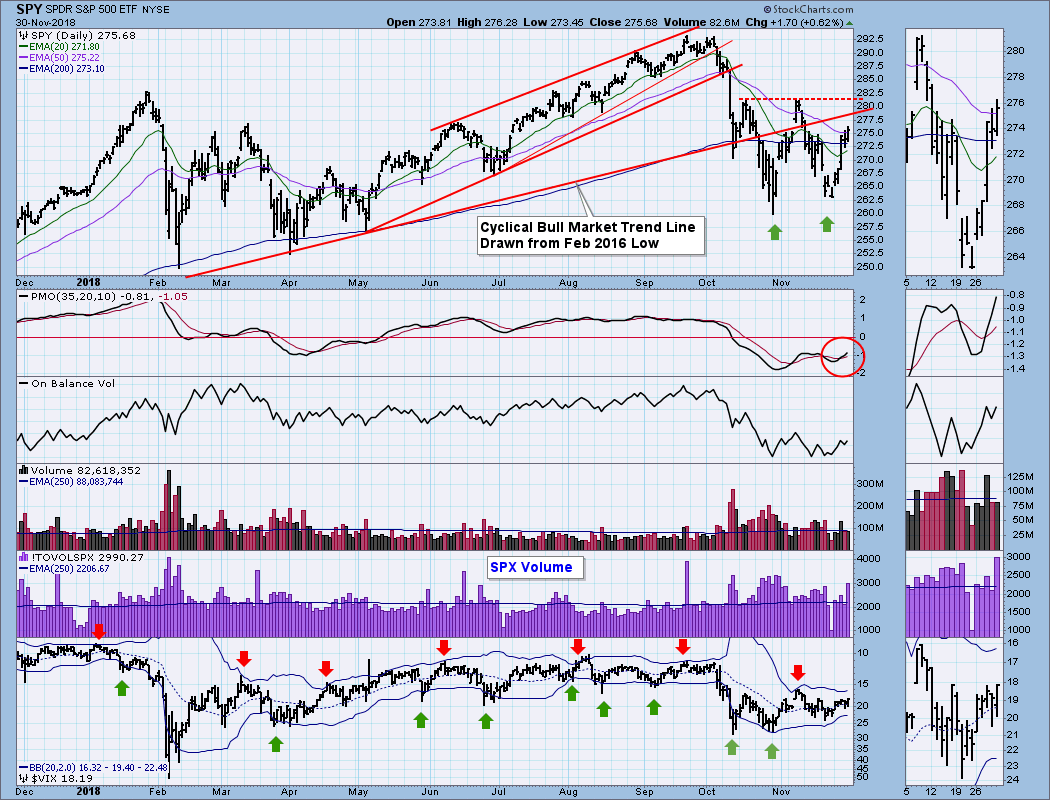
Saved again. For a second month in a row markets were on the verge of breaking their bull market trends. For a second month in a row they were saved again into month end. I’ll publish a proper Weekly Market Brief tomorrow, but I wanted to take a moment to highlight in a few charts the precision, and one might say, coordinated fashion with which all these trends were saved.

And one has to stand in awe. Just a week ago everything once again looked at the verge of breaking down, but the Bear Trap was set and stocks responded with their best week in 7 years to close out the month greatly aided by the US Federal Reserve who, like in February 2016, once again caved on their projected rate hike schedule.

The timing is impressive.

https://northmantrad...01/saved-again/


#2 dTraderB

dTraderB

    Member

  • Traders-Talk User
  • 17,279 posts

Posted 01 December 2018 - 10:31 AM

SPX closed just under the 200ma

50ma is still falling relatively fast, about 14 points away from the 200ma


Don't really trade daily double bottoms but you got to agree that is a textbook bullish one


15436608581291325227819.png


https://stockcharts....the-sp-500.html


#3 dTraderB

dTraderB

    Member

  • Traders-Talk User
  • 17,279 posts

Posted 01 December 2018 - 10:32 AM

Closed all QQQ calls

Holding VXX long, HD calls, GE stock


#4 dTraderB

dTraderB

    Member

  • Traders-Talk User
  • 17,279 posts

Posted 01 December 2018 - 10:39 AM

The next logical resistance levels are at the 2,750-2,760 range. The index moved into that range on Thursday, and again on Friday. Market participants could see a pullback taking place now to work off this week's mini rally. The headlines out of the G20 will have an impact on the next few trading sessions. Short-term support is raised to the S&P 2,720-2,725 range.

Nothing has been resolved just yet. The Bears have nothing to crow about, neither do the Bulls. Looking ahead, the Bulls need to be wary of the important support level of 2,631. If held, that would keep the higher low scenario in place. The Bears need to be wary of S&P 2,813. A true break above that level (Nov. 7th high) has the potential to take the index to new highs. Therein lies the range that investors will more than likely be facing now.

Please take note there is nothing magical about any particular level of possible support or possible resistance. The idea is to have reference points that can help reduce over trading until the market tips its hand one way or another in a more convincing and decisive manner.

saupload_uTB1807QLCT0_RY8lZ1zyjjodsAxd4H

https://seekingalpha...upport-rebounds


#5 dTraderB

dTraderB

    Member

  • Traders-Talk User
  • 17,279 posts

Posted 01 December 2018 - 10:48 AM

CARL:

CONCLUSION: The S&P 500 hasn't had a "Death Cross" yet (50EMA passes down through the 200EMA), but 51% of S&P 500 components have. I continue to believe that we are in a bear market; however, recent price action has certainly been encouraging for the bulls. The promise of the positive divergences on the chart just above has been partially fulfilled, but the short-term indicators are becoming overbought, and time could be running out on the rally. It will take an advance of just +6.5% for the market to make new, all-time highs, but, if I am right about the bear, it's not going to happen.


1543614076621394352119.png


https://stockcharts....key-did-it.html


More great charts here:


#6 dTraderB

dTraderB

    Member

  • Traders-Talk User
  • 17,279 posts

Posted 01 December 2018 - 10:50 AM

John:

The SPX has now moved back over the middle 20-day line which reflects short-term strength. And it shows also shows the upper band coinciding roughly with its early November peak at 2815, which represents an important resistance level. Weekly Bollinger bands are also providing support.

Short-Term Trend is Improving
John Murphy |  November 30, 2018 at 01:16 PM


1543618775054606014663.png


https://stockcharts....-improving.html


#7 dTraderB

dTraderB

    Member

  • Traders-Talk User
  • 17,279 posts

Posted 01 December 2018 - 10:54 AM

NAAIM:


Up from very low level last week


http://www.naaim.org...exposure-index/


#8 dTraderB

dTraderB

    Member

  • Traders-Talk User
  • 17,279 posts

Posted 01 December 2018 - 10:56 AM

As expected, up, above zero


Look at that classic divergence between the last three lows of the oscillator and the NYSE


AD and Summation Index also up, but Summation is still negative


McClellanOsc_428.gif


https://www.mcoscill...t_breadth_data/


Edited by dTraderB, 01 December 2018 - 10:57 AM.


#9 dTraderB

dTraderB

    Member

  • Traders-Talk User
  • 17,279 posts

Posted 01 December 2018 - 11:38 AM

WOW! Is this correct?


 47342447_10156455232215783_6493871022612


https://www.nasdaq.c...ons/isee-index/


#10 dTraderB

dTraderB

    Member

  • Traders-Talk User
  • 17,279 posts

Posted 01 December 2018 - 11:40 AM

For those of you without your head in the Macro Tourist sand: 10 important stock market sentiment tickers to have on your watch list $USO $GE $GBTC $GS $TLRY $AMD $ARGT $NVDA $NFLX $DB