RIP George Bush.
Dana Carvey impersonates President HW Bush and Ross Perot at a White House holiday gathering. Invited by the President himself. December 1992.

Member
Posted 01 December 2018 - 11:43 AM
RIP George Bush.
Dana Carvey impersonates President HW Bush and Ross Perot at a White House holiday gathering. Invited by the President himself. December 1992.
Member
Posted 01 December 2018 - 12:24 PM
The New York Stock Exchange (NYSE) will close on Wednesday to honor former President George H.W. Bush following his death, a spokesperson confirmed Saturday.
President Trump has called for a national day of mourning on Wednesday and ordered flags to be flown at half-staff for 30 days following Bush's death.
The former president died on Friday at the age of 94.
Member
Posted 01 December 2018 - 12:53 PM
Somewhat in agreement with most of this: I am bullish ST but markets have not reached a comfortably bullish state:
Did The “Powell Put” Change Anything? 11-30-18
Written by Lance Roberts | Dec, 1, 2018
This weekend, Presidents Trump and Xi are going to the table to discuss trade and tariffs. While I don’t expect much to actually come from the meeting, I would expect some smiles and handshaking between the two with some positive overtones on “progress being made.”
Regardless of the fact the outcome will have “no teeth” to it, and will ultimately wind up back in a trade dispute over “technology rights” before long, it should be enough to rally the bulls in the short-term.
However, I agree with Goldman Sachs assessment on Friday via Zerohedge:
“Goldman writes that it sees three basic scenarios for what happens after this weekend.
- The first and in Goldman’s view most likely outcome is continuing on the current path of ‘escalation’— tariff rates rise to 25% on all imports currently under tariff, and tariffs are extended to remaining Chinese imports.
- A close second is a ‘pause’, where existing tariffs remain in place but the two sides agree to keep talking with escalation put on hold.
- A ‘deal’, which Goldman thinks is unlikely in the near term, would involve complete rollback of the current tariffs.
The reason why Goldman is surprisingly pessimistic on the outcome is because there has been a growing sense among US policymakers that China has benefited disproportionately from the bilateral economic relationship, effectively supporting a hard-line stance against Beijing.”
While Goldman is leaning more towards an “escalation,” President Trump has staked his entire Presidential career to the stock market as a measure of his success and failure.
If President Trump was heading into the meeting this weekend with the market at record highs, I think a “hard-line”stance on China would indeed be the outcome. However, after a bruising couple of months, it is quite possible China will see an opportunity to take advantage of a beleaguered Trump to keep negotiations moving forward.
This is also particularly the case since the House was lost to the Democrats in the mid-term. This is an issue not lost on China’s leadership either. With the President in a much weaker position, and his second tax cut now “DOA,”there is little likelihood of any major policy victories over the next two years. Therefore, the risk to the Trump Administration is continuing to fight a “trade war” he can’t win anyway at the risk of crippling the economy and losing the next election.
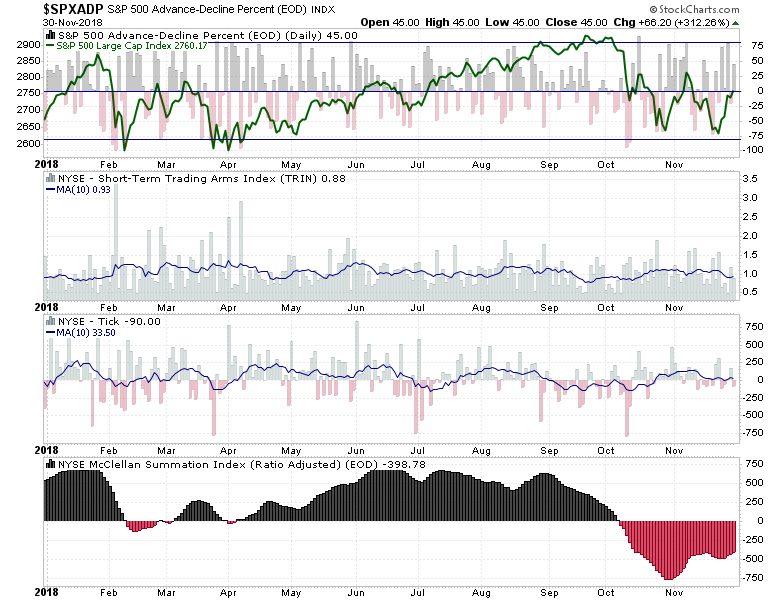
But moving to the technical picture, other than the “one day” super rally, much like we saw immediately following the elections in November, the underlying breadth and technical backdrop has not improved much. The chart below shows the Advance-Decline Percent, TRIN, TICK and McClellan Summation Index all of which have failed to show the improvement needed to establish a bottom has been put into place.
However, with that said, the market did reach extremely oversold levels during the October/November correction which provided the necessary “fuel” for a short-term rally. However, as shown below, the impending “resistance”from both the 50- and 200-dma will likely prove to be a fairly formidable obstacle for the markets to breach in the near-term.
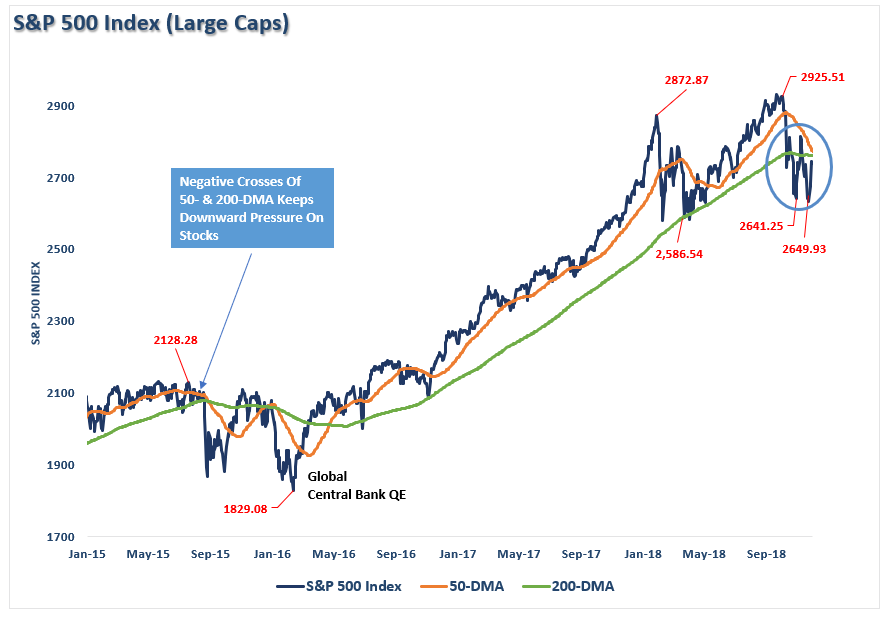
However, notice that in 2015 the market did briefly break above the 50-dma just before the crossover occurred which dragged prices back down with it. The trend of the market is still negative currently, so risk remains to the downside for now. As Victor Dergunov penned last week, the headwinds to the market continue to mount.
With the Fed out of the way until mid-December, the focus for the markets will be any hint of a “roll back” on Trump’s positioning with respect to China, trade, and tariffs.
After having reduced equity risk a couple of weeks ago, we are looking for opportunities as they present themselves. However, for the most part, our bond positions have continued to carry the bulk of the load as of late.
https://realinvestme...ything-11-30-18
Member
Posted 01 December 2018 - 08:40 PM
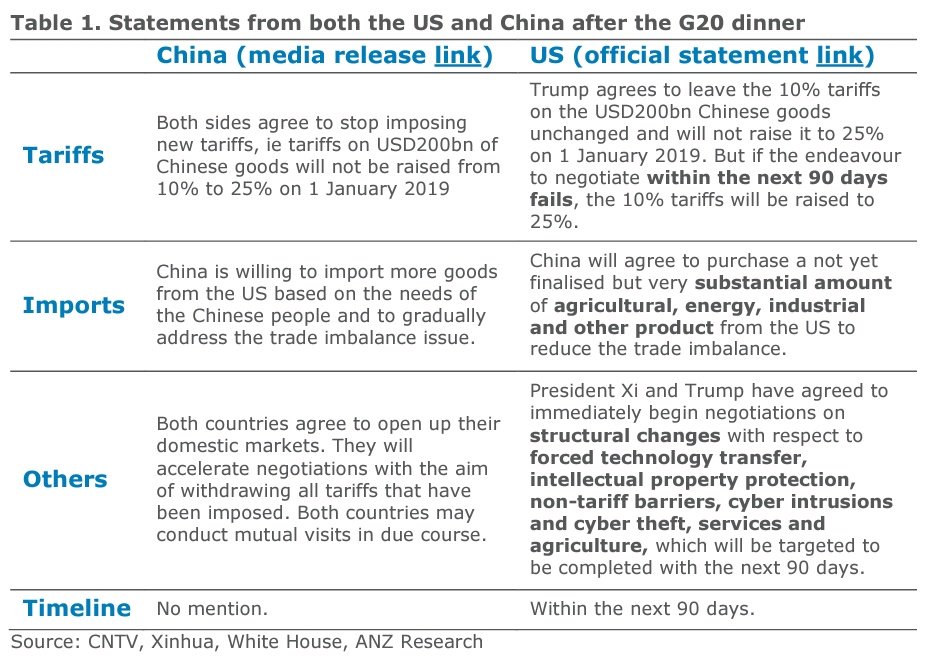
If you believe the Chinese media, Trump & Xi have a deal, not earth-shattering, but bullish:
Presidents Xi and Trump Agree Not to Add Further Tariffs After Jan. 1, Chinese Media Says
President Trump and Chinese President Xi Jinping agreed there will be no additional tariffs imposed after Jan. 1
https://www.bloomber...1-cgtn-jp65zrtt
Member

Posted 01 December 2018 - 11:00 PM
love reading your posts dTraderB! thanks again for sharing 
Member
Member
Posted 02 December 2018 - 09:07 AM
Unless something extraordinary happens, expect at least 50 SPX points from the "favorable" Trump/Xi talks
During the last 5 days, the interest rate & Trade War problems were solved or finessed or.... just taken off the wall of worry, even if temporarily
Edited by dTraderB, 02 December 2018 - 09:08 AM.
Member
Posted 02 December 2018 - 11:13 AM
Yeah, that December rally SEEMS to be baked in....just eat & enjoy while it lasts!
The Yield Curve Is Not Forecasting A Recession
By now, most anyone who keeps up with financial matters knows that a flat or inverted Treasury yield curve is a good predictor of an impending recession. I've blogged extensively on this subject for almost 10 years. Recently, a few industrious pundits have found evidence that the front end of the Treasury curve is "close to flat." While it's hard to argue with their facts, an almost-flat curve is not the same as a flat or inverted curve. The latter occur only when the market looks into the future and sees good evidence that the Fed will no longer tighten policy and will very likely ease policy at some point. We're not there yet.
Here's a quick recap of where the yield curve stands:
Chart #1
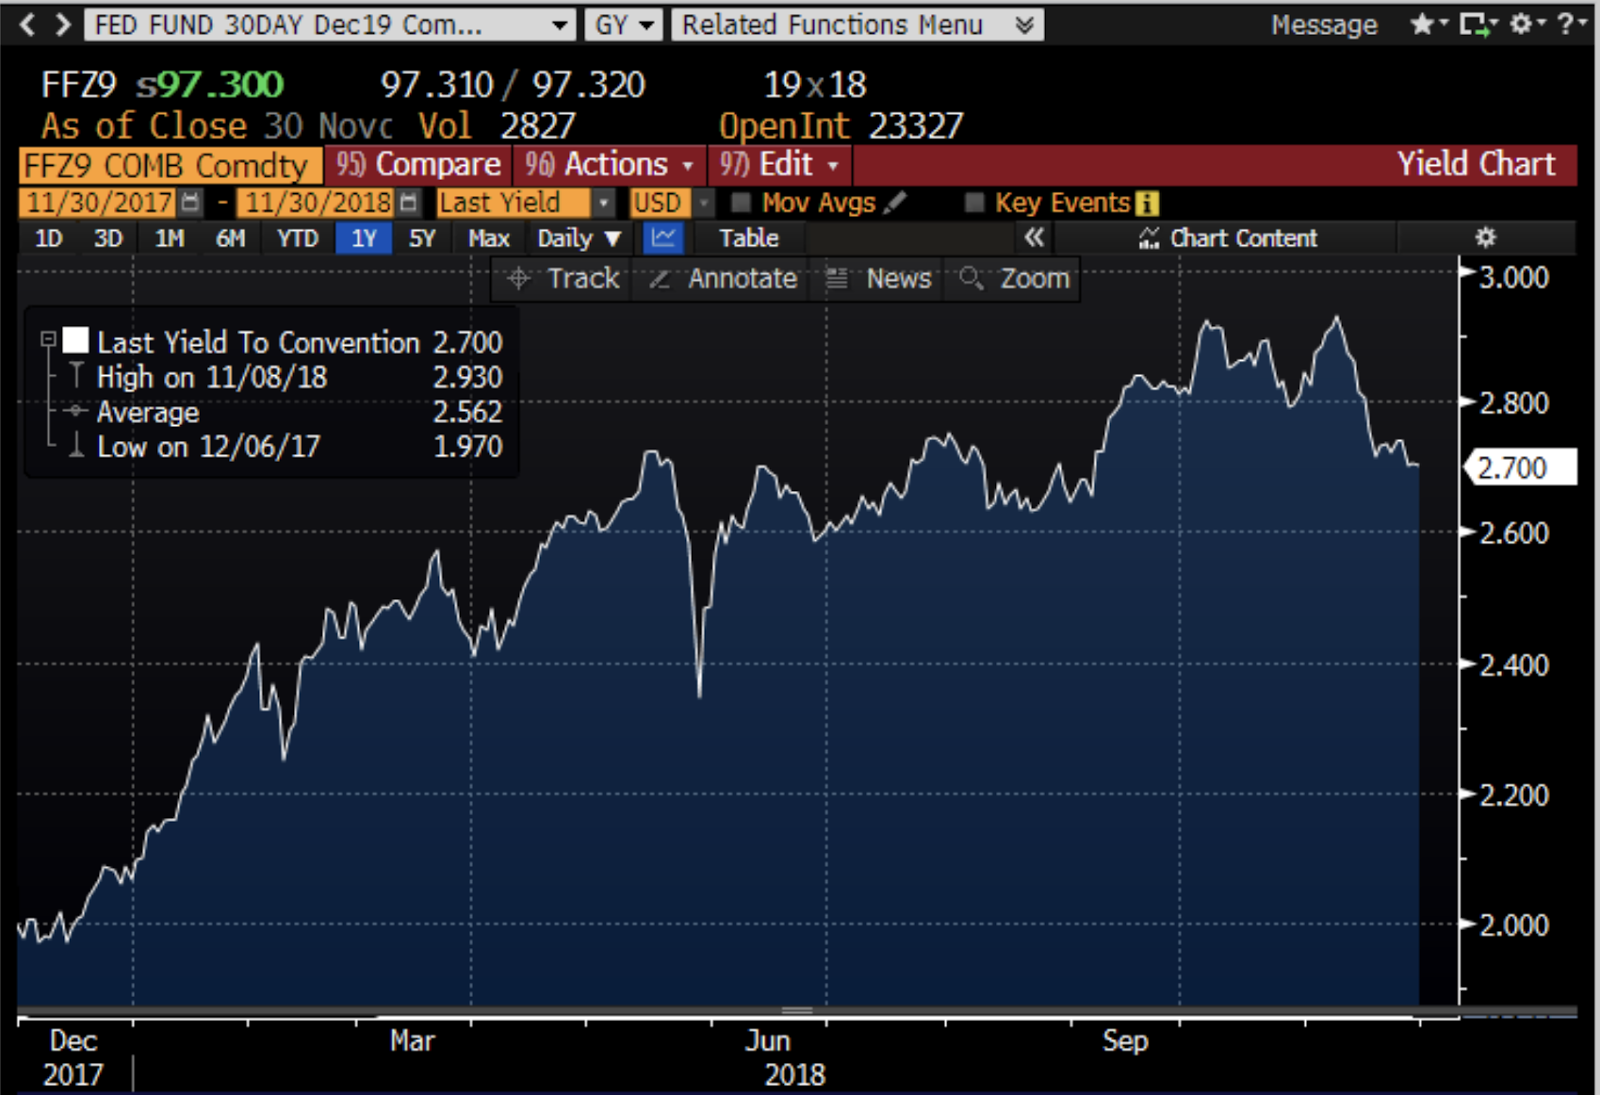
Chart #1 shows us what the market has thought the target Fed funds rate will be in December of next year. One year ago, on the left end of the chart, the Fed funds futures market expected the funds rate to be 2.0% by December '19; it now expects the funds rate will be 2.7% by December of next year. That is essentially equivalent to two more Fed tightenings, from the current 2.25% to 2.75%. Currently, the market does not expect the Fed to do anything more beyond December '19. "Two more rate hikes and the Fed is done" is the current meme. That implies that the economy is quite likely to continue growing for the foreseeable future, but not at a very impressive (nor worrisome) pace. Note that expectations for the future target rate have dropped by almost one tightening in past few weeks, and that in turn has been driven by news suggesting the economy is proving a bit weaker than previously thought.
https://seekingalpha...sting-recession
Member
Posted 02 December 2018 - 11:17 AM
Despite the rally last week nothing however has changed with our long term analysis as we still think the market is entering bear market territory given what we've been saying about the weekly and monthly long term charts and various economic indicators.
For the short and intermediate term we think this rally will ultimately form a lower high. In the short term as far as mapping purposes, one possible wave count we are monitoring is that the market put in an intermediate wave A low during Thanksgiving week, and is now in an intermediate wave B bounce, which will ultimately make a lower high (I discuss this in charts #14 and 15 below). If this is the pattern, we would expect prices on the SPX to push higher still, perhaps back to the 2815 or even the 2860 area before it fails. However in the short term there is clear negative divergences via the MACD and RSI indicators on the 60 min time frame that suggests an imminent pullback in the short term. This is a corrective pattern and corrective patterns are abc in nature. So far the move off last week's lows has been one wave, which we are marking as wave a. I would soon expect a wave b pullback to retrace part of this move off the lows, then a wave c up to complete the intermediate wave B. Realize that corrective patterns can take many forms and they are notoriously to trade and emotional.
Member
Posted 02 December 2018 - 11:21 AM
Beauty, as well as the deal, is in the eye of the beholder.

Edited by dTraderB, 02 December 2018 - 11:23 AM.


