Edited by CLK, 05 December 2018 - 10:08 AM.

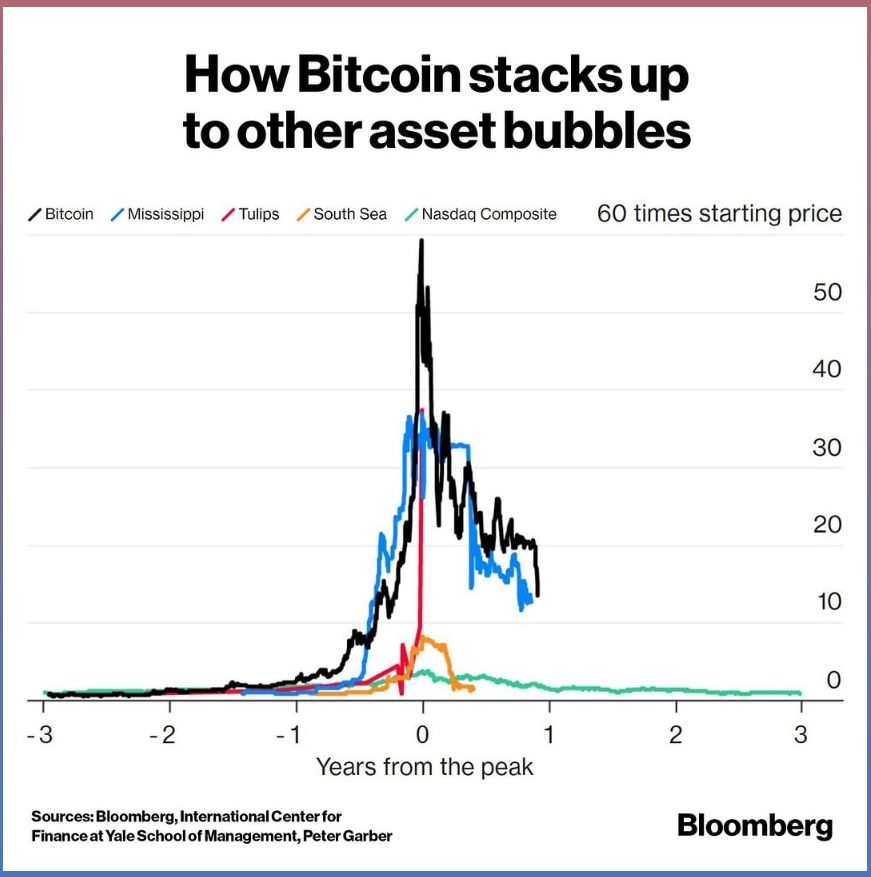
So you think Bitcoin was a parabolic top......
Started by
CLK
, Dec 05 2018 10:01 AM
6 replies to this topic
#3

tsharp
-

- Traders-Talk User
- 1,487 posts
Member
Posted 05 December 2018 - 10:29 AM
By many standards, BTC has been the greatest asset bubble of all time...
#4
LMF
-

- Traders-Talk User
- 801 posts
Member
Posted 05 December 2018 - 10:41 AM
Definitely one of the greatest bubble tops on Bitcoin.....and the definitive marker is not really the price trend shape, although that can be a good clue (the Eiffel tower profile). The exact marker is the 52 week rate of change, how high can it go. And bitcoin topped out at 2600 percent on the 52 week ROC. That's about the highest I can find right now. There may have been even bigger bubbles back in 2000 but most of the charts are not around anymore. QCOM is one of the few left.....it also hit 2600 percent in early 2000. 18 years later it finally got all the way back up to the highs just recently. That's what bubbles do......the ROC never comes back, and stays relatively flatlined after the top. NVDA for example is not even close with just a wimpy 350 percent ROC at the top so far.....just a little soap bubble by Bitcoin standards.
#5
CLK
-
- Traders-Talk User
- 10,787 posts
Member
Posted 05 December 2018 - 11:11 AM
I'm looking to buy 2 yr leaps on bear ETF's here and add to growth stock positions for the long term. I don't think you want to be
100% long or short in this environment unless it's a short term trade.
Markets don't go up on Dow and S&P, this is an ominous sign, Q's and IWM are making consistent lower highs and now Q's just suffered a 50/200 cross. I wouldn't try to be a hero here and hold for 2850, I don't think it's going to happen, we had two failed inverse H&S setups, now everyone is counting on the "W" to come through. In a bear market you sell your buy patterns. Upside is 2740-50 then new lows is my take.
Edited by CLK, 05 December 2018 - 11:12 AM.
#6
LMF
-
- Traders-Talk User
- 801 posts
Member
Posted 05 December 2018 - 12:07 PM
As long as the Feb lows continue to hold, this should end up being a big continuation pattern to the upside sometime in 2019. Particularly on QQQ and TQQQ as the best barometers. But this market has to get past the March 29 Brexit date without a derivatives meltdown. And even if the Fed stops hiking they're still cutting the balance sheet which is not a good path to a sustained upmove now. Its a big trading range.....
#7
CLK
-
- Traders-Talk User
- 10,787 posts
Member
Posted 05 December 2018 - 12:55 PM
As long as the Feb lows continue to hold, this should end up being a big continuation pattern to the upside sometime in 2019. Particularly on QQQ and TQQQ as the best barometers. But this market has to get past the March 29 Brexit date without a derivatives meltdown. And even if the Fed stops hiking they're still cutting the balance sheet which is not a good path to a sustained upmove now. Its a big trading range.....
NYA already went below the Feb. lows.


