Jump to content


Photo

System BULLISH, intuition BEARISH


  • Please log in to reply
12 replies to this topic

#1 dTraderB

dTraderB

    Member

  • Traders-Talk User
  • 17,201 posts

Posted 08 December 2018 - 11:16 AM

...and SYSTEM wins more often than INTUITION. 

In this case, I go for the easy (& cowardly) choice and over-rule both of the above: FLAT !


Well, those super big-ly daily and hourly ranges  & True Ranges have been processed by my system and it 

says to BUY.  One major factor is this:

Friday's SPX low & high were higher than the previous day. 


My intuition says SELL and more than 75% of my trades in Friday were SHORTs.

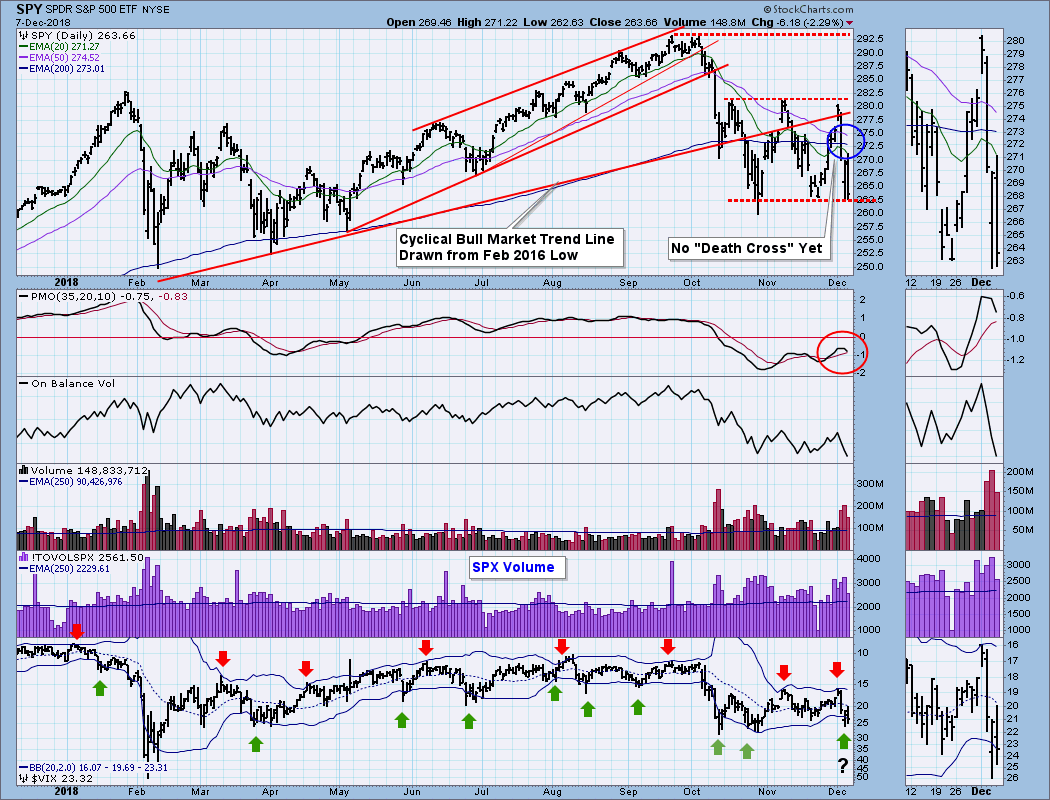
And, how can you BUY when the dreaded death cross just happened? (Carl has a different take on this, he may be right!, see below)


If the SPX daily close is below Thursday's close then the SYSTEM will go SHORT

If the SPX daily close is above Friday's close then the SYSTEM will continue to be LONG

----

CARL:

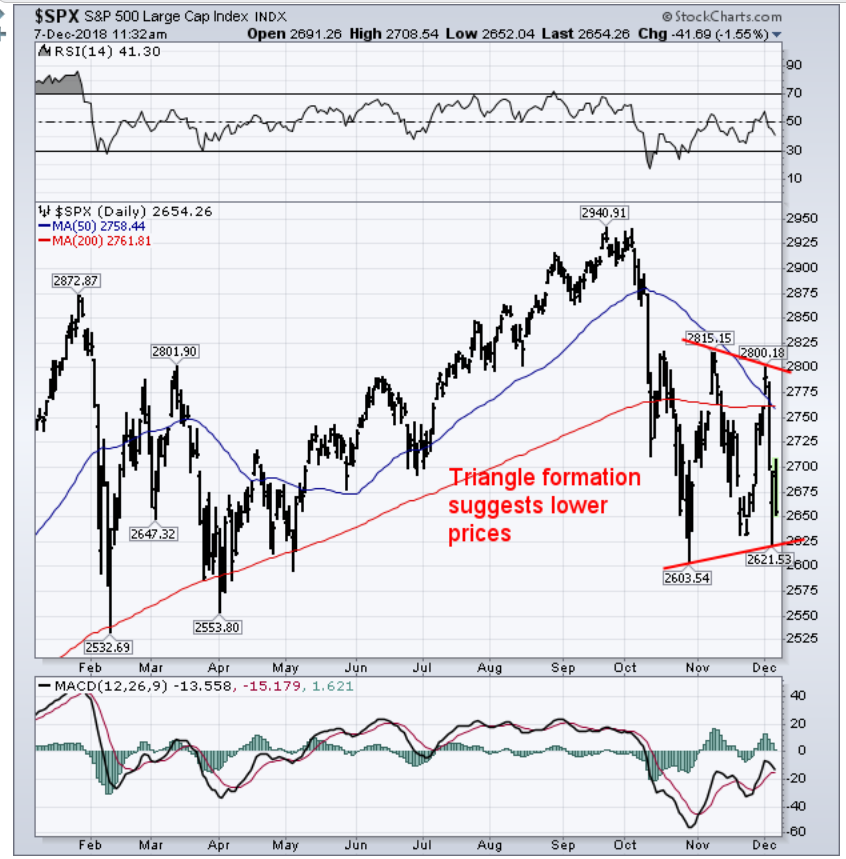
There will probably be a lot of people mentioning that today there was a "Death Cross" on the S&P 500 chart, and this is important because a Death Cross means that the price index has entered a bear market. Specifically, on the $SPX chart (not shown) the 50-day simple moving average crossed down through the 200-day simple moving average (SMA). I don't use SMAs because I believe exponential moving averages (EMAs) behave more rationally. And for signal generation and trading decisions I track SPY instead of $SPX, which can actually be traded. Also, like stocks, SPY is adjusted for distributions, which reflects the total return of the index. As you can see on my chart, there has been no 50/200EMA downside crossover yet. I think that it is inevitable, but it could quickly be avoided if SPY were to rally above the EMAs, because that would cause the EMAs to turn up and begin separating again. That wouldn't necessarily happen with an SMA because of the way they are calculated. (See the Chart School article on moving averages for more info.)


1544218777097903563038.png


https://stockcharts....-fireworks.html


#2 dTraderB

dTraderB

    Member

  • Traders-Talk User
  • 17,201 posts

Posted 08 December 2018 - 11:19 AM

These guys have been right, recently:


Keith McCullough Retweeted

This 60-second clip of @KeithMcCullough on “The Macro Show” beats anything you’ll see on CNBC all day. Except the E*Trade monkey commercial—it’s tough to compete with that 1f412.png


https://app.hedgeye....rope?type=macro


#3 dTraderB

dTraderB

    Member

  • Traders-Talk User
  • 17,201 posts

Posted 08 December 2018 - 11:29 AM

From BARRON'S


What is your outlook for 2019?

If you go back to the idea of this period being reminiscent of 1998, we’ve had an emerging market crisis this year with Turkey and Argentina. We’ve had a risk-off environment—it was only a 10% correction in the U.S., but we saw 20% corrections in the international markets, nearly 30% in China, and some meaningful currency adjustments. But even in the U.S., we had 75% of stocks trading below their 200-day moving average. You can make a case that there may be a trading opportunity for markets to be less risk-averse if the Fed pauses or oil prices stay low. But in 2019 and beyond, we don’t feel that there’s a lot of latency in fundamentals, just given how far advanced the business cycle is around the world. Even though price/earnings multiples look reasonable in many markets, margins are very high. One of the things that has driven margins to high levels has been very easy fiscal policy. We’ve brought forward profitability. If we look bottom-up at stocks on an enterprise-value-to-revenue basis, they are not so cheap. So we have modest expectations beyond any sort of short recovery in sentiment.


Is debt a worry for you, too?


Debt levels are high around the world. Take household debt, nonfinancial corporate debt, and sovereign debt, and compare them to gross domestic product in the U.S., Europe, China, and Japan. We’re at higher debt levels than we were in 2007. It’s like if you borrowed a lot of money to build a bigger house than you need: In the short term, that’s good for growth and confidence, but once you’ve taken on the debt and built the house, you’re essentially stuck with the fact that you have to maintain a house that is bigger than what you need. This is essentially the problem with the Chinese economy. On top of that, if you have already levered up, you can really only grow through savings and retained earnings, and you have more modest growth. We face that challenge in the world economy as a whole.

A Top Money Manager Sees Rally Nearing Its End

matthew mclennan likes to compare himself to a gardener—one who cultivates stocks that will grow over the long term.

Without doubt, First Eagle Global (ticker: SGENX) has thrived under McLennan’s care. The $51 billion fund, which earns a five-star rating from Morningstar and has below-average fees, has outperformed its world-allocation peers in the past decade, returning more than 9% per annum.


#4 dTraderB

dTraderB

    Member

  • Traders-Talk User
  • 17,201 posts

Posted 08 December 2018 - 12:08 PM

TIM ORD: 

Dec 6th 9am


SPX Monitoring purposes; Long SPX on 10/22/18 at 2755.88.
Monitoring purposes GOLD: sold 11/27/18 at 18.88=gain .075%; Long GDX at 18.72 on 8/17/18
Long Term Trend SPX monitor purposes;  Long SPX on 10-19-18 at 2767.78

1544116003960853225860.gif

The American Association of Individual Investors' bull bear ratio (AAII) has reached levels where intermediate term lows have formed. The .75 level of the 3-period moving average (AAII) has been hit, suggesting markets are at an intermediate term low. The TRIN closed at 2.76 and Ticks at -357, producing panic readings that suggest a bottom will form from today to as late as two days later, which is Friday. With the McClellan Oscillator rallying +500 points to early November, suggesting an initiation of an up-move after the current pull back, we expect another rally higher.

https://stockcharts....ber-6-2018.html


#5 dTraderB

dTraderB

    Member

  • Traders-Talk User
  • 17,201 posts

Posted 08 December 2018 - 03:41 PM

"...Stock prices today are down a tad over 10% from their all-time highs of last September, as shown in Chart #16. That's mostly due to an increase in the market's worries (as measured by the ratio of the Vix index to the 10-yr Treasury yield), but it also reflects the fact that the economy has failed to accelerate as supply-siders (like me) had expected. Growth has picked up modestly in the past two years, but not as much as we would have liked to see considering how much deregulation and tax-cutting there has been in the interim.

China is the wild card these days, but it's also the case that for the next two years we're going to have a divided Congress that is unlikely to pursue a pro-growth agenda, and there are few signs, if any, that global growth is picking up.

The market has priced in a lot of slowdown expectations. According to Bloomberg, the current PE ratio of the S&P 500 is 18, and that's as low as we have seen since February '16. Today's equity premium (the difference between the earnings yield on stocks and the yield on 10-yr Treasuries) is 2.7%, and that's as high as we've seen since November '14. This rather substantial repricing of equities is a potential positive, since it makes taking risk more attractive, and that in turn helps offset the de-risking forces of uncertainty emanating from places like China and Congress. Clouds and silver linings.

The question confronting investors today is not whether the economy is going to slow down (that's priced in already); the question is whether it is going to slow down by a lot, and how certain one is of that future. In this regard I remain optimistic that things won't be as bad as the market already fears. That's been my position for the past 10 years, actually: always thinking that the market was too pessimistic in its assumptions about the future. "


Walls%2Bof%2Bworry.jpg


#6 dTraderB

dTraderB

    Member

  • Traders-Talk User
  • 17,201 posts

Posted 08 December 2018 - 03:43 PM

Bears kept screaming about artificial volatility compression, nobody listened. One can ascribe all kinds of narratives to this time: It was an illusion, it was manufactured, it was a pervasion of the global market price discovery mechanism.

But no more. Volatility has freed herself:

VXO.png?resize=639%2C281&ssl=1

The perversion that was 2017 is over. And volatility is celebrating her new found freedom.

But don’t think she has gone amok, she’s merely returned to the range of her historic playground. Nothing what we are witnessing now is extreme, it’s part of the historic range. But participants have forgotten. Dulled by years of artificial compression bad habits have developed.

For traders this is the environment we’ve been wishing for to return. Wide price ranges in both directions. Ultimately traders don’t care in which direction markets are moving, they just want them to move. Identify technical setups and edges and execute on them. And with volatility freed these setups are coming frequently now.

So traders don’t fear volatility instead embrace her, if respected she can be your best friend. As to investors in passive ETFs take heed: The time of complacency has ended and perhaps making money in markets may require more discerning decision making than just sticking cash into ETFs. Times are changing. Volatility, she’s back.


#7 dTraderB

dTraderB

    Member

  • Traders-Talk User
  • 17,201 posts

Posted 08 December 2018 - 04:16 PM

So far, the consolidation of the market has continued to give supports to bulls case as sentiment has gotten very negative during this time. However, as I noted on Tuesday for our RIA PRO subscribers:

“Most importantly, the most recent failure at key resistance levels has set the market up to complete the formation of a ‘head and shoulder’ process. This is a topping pattern that would suggest substantially lower asset prices going into 2019 ‘IF,’ and this is a key point, ‘IF’ it completes by breaking the lower ‘neckline.’” 

Chart updated through Friday

SP500-Chart2-120718-2.png

John Murphy via Stockcharts.com confirmed the risk to prices as well on Friday:

S&P 500 MAY HAVE MORE DOWNSIDE TO COME …

The daily bars in the chart shows the S&P 500 retesting previous lows formed in late October and late November. And it’s trying to hold there. The shape of the pattern over the past two months, however, isn’t very encouraging. Not only is the SPX trading well below its 200-day average. The two red trendlines containing that recent sideways pattern have the look of a triangular formation (marked by two converging trendlines). Triangles are usually continuation patterns. If that interpretation is correct, technical odds favor recent lows being broken.

If that happens, that would set up a more significant test of the lows formed earlier in the year. Other analysts on this site (besides myself) have also been writing about that possibility. That would lead to a major test of the viability of the market’s long-term uptrend.”

SP500-Chart3-120718.png

Also, note that the lower MACD is close to registering a “sell signal” which would likely coincide with further weakness in asset prices.

Is there any hope a bigger decline can be averted? Absolutely.

The recent market turmoil, which threatens both consumer confidence and the household wealth effect, has shaken the Fed from their “hawkish” position. In the next few days, the market will be analyzing Jerome Powell’s latest message as the Fed hikes rates 0.25% in December. If the language of the announcement becomes substantially more “dovish,” and signals no more hikes into 2019, the markets will initially rally sharply on the news. However, given that a Fed pause at 2.5% would signal much slower economic growth, it will likely only be a temporary boost until weaker earnings are realized from slower economic growth.

The other potential opportunity is for the current Administration to drop the “trade war” rhetoric. Given that Trump created the “trade problem” to begin with, even small gestures of trade improvement between the U.S. and China would be counted as a “Trumpian victory.” However, a reversal or reduction of the tariffs would be a boost to corporate earnings and provide a boost of confidence to corporations.

Again, as with the Fed funds rates, the reduction of tariffs would most likely only provide a short-term boost to asset prices. Eventually, the focus of the markets will turn back to earnings and economic growth which are going to slow as previous boosts from natural disasters and tax cuts fade. 

https://realinvestme...th-you-12-07-18


#8 redfoliage2

redfoliage2

    Member

  • Traders-Talk User
  • 18,002 posts

Posted 09 December 2018 - 09:58 AM

The so called head is way too small to be a head on that SPX chart. But Id not be too surprised to see this market runs like a chicken without a head.

Edited by redfoliage2, 09 December 2018 - 10:02 AM.


#9 dTraderB

dTraderB

    Member

  • Traders-Talk User
  • 17,201 posts

Posted 09 December 2018 - 11:26 AM

Outlook: This coming week will likely be the defining moment for buyers and sellers. Sellers still haven’t been able to make new lows, but monthly trend lines are again at risk of breaking. Sellers need to break them this week and sustain a break below outlined support levels or risk getting run over by positive seasonality to come. Remember all headlines have turned negative for bulls, but still bears haven’t been able to capitalize other than chop inside the range. Buyers may need just one positive trigger to switch sentiment on a dime, but the proof would only come with a confirmed bottom which will require a weekly close back above the weekly 50MA which currently sits at 2742 $ES.


So is the Bear Trap #2 case I raised this week dead? It sure looks like it at the moment. But not so fast.

Several considerations that may still work in favor of bulls here for year end. For one, the powers that be have made their preference clear: They want markets higher. The Fed has gotten the message but hasn’t found the formula. Trump clearly wants higher prices but he keeps sending Navarro in front of the cameras. He may have to decide quickly which one he wants as he clearly can’t have both. Markets want confidence and they don’t have any at the moment.

Can Theresa May deliver a surprise next week? It seems highly unlikely, but if she does or delivers something that markets like in form of a compromise offer Europe may decide to rally. Next week also ends the poor seasonality window for stocks and closely watched central bank meetings by the ECB and the FOMC will become front and center.

As bad as December has been so far the weakness fits inside the seasonal script. December OPEX week tends to be bullish, the Fed is also meeting that week and then it’s supposed traditional Santa rally time.

The Fed has been desperate to keep sending dovish signals and the President himself,apparently obsessed with stock market levels, has been trying his dearest to sweet talk markets with tweets. With no avail on either count. Markets are ignoring the Fed and they choose to focus on the negative on China coming from Navarro who apparently plays the evil twin to Kudlow who is the go to guy for jawboning markets higher.

Markets are not buying it and every spike has been sold.

I’ve been highlighting the lower risk zone that could come into play if markets break the October lows and, given the range consolidation, I’ve expanded the risk zone lower:

SPXW.png?resize=639%2C478&ssl=1


https://northmantrad...the-cusp-again/


#10 dTraderB

dTraderB

    Member

  • Traders-Talk User
  • 17,201 posts

Posted 09 December 2018 - 11:28 AM

Douglas KassVerified account @DougKass
FollowFollow @DougKass
More

Coming up on @realmoney tomorrow morning: The Top Ten Reasons We May Be Entering a Bear Market https://www.youtube.com/watch?v=2MyToTwag34  And Some Pearls of Wisdom from the legendary Marty Zweig @tomkeene @jimcramer @carlquintanilla @andrewrsorkin @beckyquick @saraeisen @SullyCNBC