I have a different wave count: (3) of (3) of (3) DOWN.

ST Bullish, IT Bullish - Bears attack during night session
Started by
dTraderB
, Dec 14 2018 06:58 AM
18 replies to this topic
#11

beta
-

- TT Patron+
- 4,091 posts
lasergirl
Posted 14 December 2018 - 01:25 PM
"Daytrading -- An Extreme Sport !"
#12
ryanoo
-

- Traders-Talk User
- 660 posts
Member
Posted 14 December 2018 - 01:53 PM
I have a different wave count: (3) of (3) of (3) DOWN.
Can you show your chart?
there are 3's here too ...

#13
beta
-
- TT Patron+
- 4,091 posts
lasergirl
Posted 14 December 2018 - 02:01 PM
Sorry cant post. Just buy inverse ETF or AMZN puts, and hold on for the ride.
Not too late to panic ... yet.
"Daytrading -- An Extreme Sport !"
#14
dTraderB
-
- Traders-Talk User
- 17,409 posts
Member
Posted 14 December 2018 - 02:18 PM
Repeated assaults on the SPX 2600 critical level.
Market has been battered, intense selling, and if it does not hold here then
a daily close below SPX 2600 can lead to a SPX 2400 handle in a few days.
SPX 2400 handle may appear to be far away but with SPX at 2605, it is only 106 SPX points away.
However, I still regard current behavior of the market as "hammering out an IT bottom" that will then lead to a rally for rest of year and into early January 2019.
#15
12SPX
-

- Traders-Talk User
- 12,577 posts
Member
Posted 14 December 2018 - 02:22 PM
Repeated assaults on the SPX 2600 critical level.
Market has been battered, intense selling, and if it does not hold here then
a daily close below SPX 2600 can lead to a SPX 2400 handle in a few days.
SPX 2400 handle may appear to be far away but with SPX at 2605, it is only 106 SPX points away.
However, I still regard current behavior of the market as "hammering out an IT bottom" that will then lead to a rally for rest of year and into early January 2019.
Yes I agree think the close will reveal quite a bit. I think the volume is telling a lot.
#16
dTraderB
-
- Traders-Talk User
- 17,409 posts
Member
Posted 14 December 2018 - 04:02 PM
There you see why I don't trade near IT or LT lows, near that range.
This type of market behavior may continue, between SP 2580 and 2620, for some time until it resolves one way - up or down.
SPX finishes at 2600
There still may be unfinished business to the downside before the year nd rally.
Bought 5 MARCH 2019 SPY 260 CALLS
#17
Waver
-

- Traders-Talk User
- 802 posts
Member
Posted 14 December 2018 - 09:42 PM
tsharp
Your correction/triangle still active or no longer valid?
Your correction/triangle still active or no longer valid?
#18
tsharp
-

- Traders-Talk User
- 1,487 posts
Member
Posted 15 December 2018 - 12:23 AM
tsharp
Your correction/triangle still active or no longer valid?
Either it completed today or has extended until after the new year... I think the latter makes more sense at this time - wave-c:iv would equal wave-a:iv on or about 1.8.19. My SAR swing signal is still short from 2660.


#19
tsharp
-
- Traders-Talk User
- 1,487 posts
Member
Posted 15 December 2018 - 10:18 AM
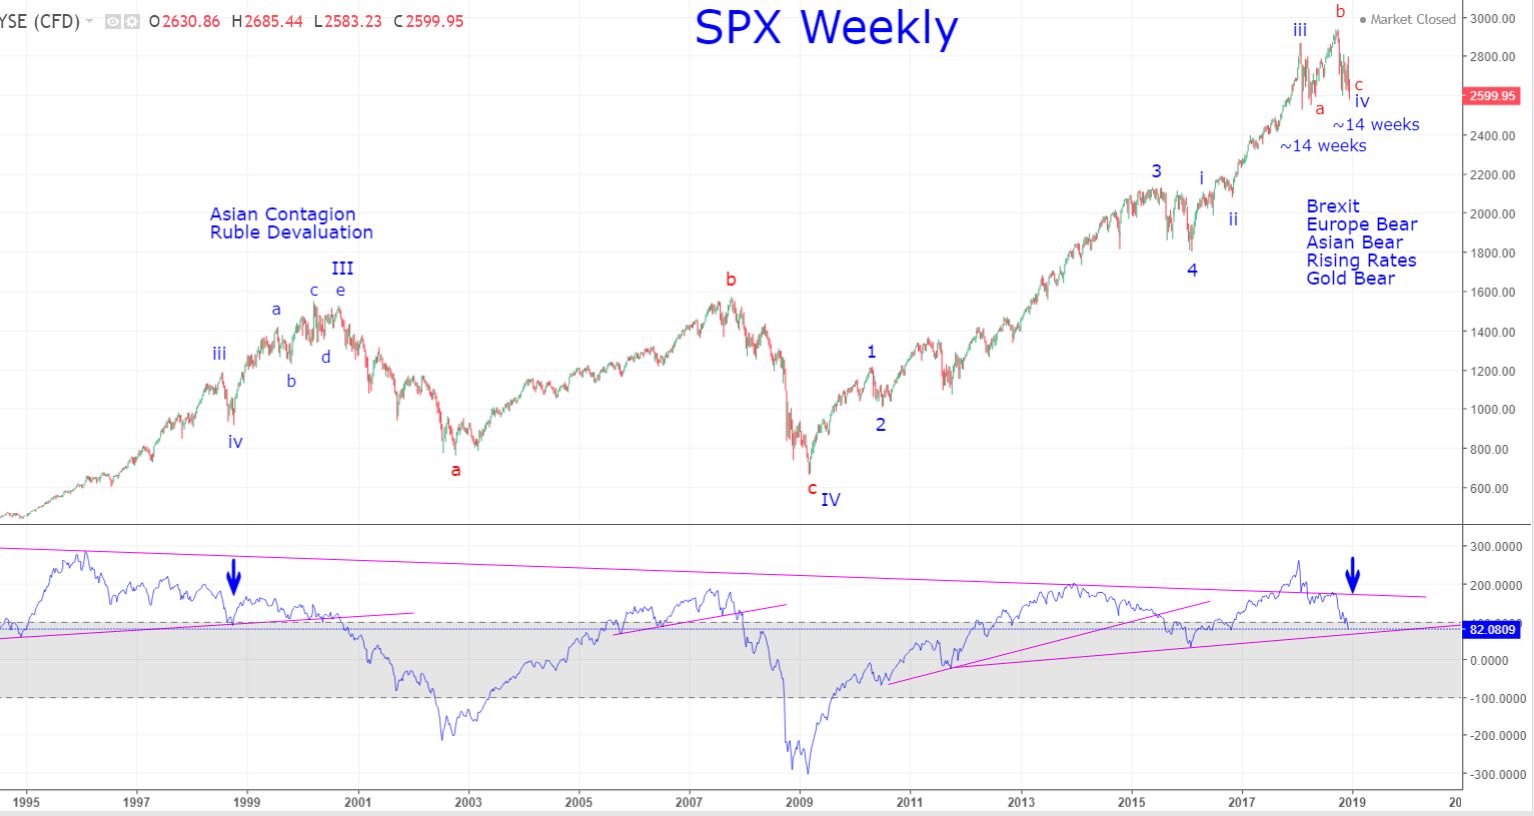
My perspective via the SPX weekly... I see this transition as similar to the wave-iv low in the previous 1998-2000 top... the rise then was IN SPITE of the issues at the time, whereas the rise now will be the perfect storm - BECAUSE of the issues: Brexit, continuing LT bear market in gold, beginning of the LT bear market in bonds (rising rates), bear market in Europe, bear market in Asia - capital will continue flowing to the US dollar and equities.
I also see the next leg upward as being similar to the EDT that completed in 2000... wave-a:iv was about 14-weeks, wave-c:iv will be about 14-weeks in the early part of January 2019... watching.