Jump to content


Photo

BEAR at the door - Fear & Panic in Wall St


  • Please log in to reply
50 replies to this topic

#1 dTraderB

dTraderB

    Member

  • Traders-Talk User
  • 17,212 posts

Posted 15 December 2018 - 02:02 PM

1024x420-bear-resistant-folding-door.jpg


The Bear is here but still outside the door, ready to enter, as fear & panic permeate many sectors of Wall St.


SPX daily close is still above 2600, the FED meets this week, the Trade War is thawing and taking a break, and it is a seasonally bullish period, so I am still not in the bear market category, but looking for a rally now, and then the real decline begins in January, maybe late in that month. 


The FED should raise rates, it must or else the market will crumble after an initial pop, but don't be surprised if the FED language is more dovish (bullish for equities)  than many expect. The FED will be in a sweet spot after this rate hike and may throttle back any planned hikes in 2019 until at least the end of Q1. ....unless there is a surprising rise in inflation.


Technically, the market is weak, death cross in place, but unless there is a lower SPX swing low in the daily charts followed by a lower high, the bear will have to stand outside the door, no entry.


2019 will be a down or flat year with SPX trading in a fairly wide range - from 2200 to 2800, with the possibility of new record highs in the SPX and NASDAQ but this seems more and more unlikely.


#2 dTraderB

dTraderB

    Member

  • Traders-Talk User
  • 17,212 posts

Posted 15 December 2018 - 02:03 PM

The overwhelming consensus of economists is that the Fed is likely to raise its benchmark interest rate by a quarter-point to a range between 2.25% and 2.5% at the end of their meeting on Dec. 19. Financial markets continue to see over a 75% chance of a move.

Read: Fed still likely to raise interest rates in December

But the messaging in the Fed’s dot plot of interest-rate projections, policy statement and Fed Chairman Jerome Powell’s press conference are all more important than the move, and most economists think they will uniformly lean dovish, analysts said. At some point, perhaps as soon as March, the Fed will skip a quarterly rate hike. At the moment, most economists think that will be a pause and not the end of the tightening cycle.


https://www.marketwa...sage-2018-12-13


#3 dTraderB

dTraderB

    Member

  • Traders-Talk User
  • 17,212 posts

Posted 15 December 2018 - 02:55 PM

BS

The FED watches the market every second but does not intervene unless absolutely necessary. It is not 

a matter of saving the market but more focus on stability, etc; hence, the FED does not create and implement policy to create  BULL or BEAR markets but 

their policies will affect the markets


Here’s why the Fed won’t save the stock market, despite its worst December start since 1980


https://www.marketwa...1980-2018-12-15


#4 dTraderB

dTraderB

    Member

  • Traders-Talk User
  • 17,212 posts

Posted 15 December 2018 - 02:58 PM

This sounds great but 10% rise from SPX 2600 is 2860

Yet as U.S. stocks stumble toward what could be their first yearly loss since 2015, next year is looking rather sunny. So say the 10 market strategists Barron’s consulted this month, all of whom have 2019 targets for the S&P 500 index that are higher than the benchmark’s recent price level of 2600. Based on the group’s mean prediction, the S&P 500 will end next year at 2975, indicating a gain of more than 14%.


The strategists, who mostly hail from investment banks and asset-management firms, offered up individual S&P targets ranging from 2750 to 3100. The stock market is down almost 3% this year, as measured by the S&P 500—a disappointing showing in any year, but especially so after last year’s nearly 20% gain.

2019 Outlook: U.S. Stocks Could Rally About 10%


https://www.barrons....019-51544837183


#5 dTraderB

dTraderB

    Member

  • Traders-Talk User
  • 17,212 posts

Posted 15 December 2018 - 02:59 PM

The days when Fed-engineered low rates made everyone a winner are over. As as companies refinance their debt—some more urgently than others—investors have to make more complex calculations.


Tech stocks have struggled in recent months, but the big drivers haven’t changed. Here are stocks benefiting from the multi-year disruptive trends.


The Dow joins the S&P 500 and Nasdaq as investors bail out of equities. Can the markets dodge a bear market?


Low-volatility ETFs have declined less than the S&P 500 in the past couple months, giving some investors shelter from steep market swings.


Trading of exchange-traded funds has long been seen as a potential hazard in a falling market. But those fears may be overblown. Plus: Why that winning actively managed fund may not be winning for much longer.


Liz Ann Sonders, Schwab’s chief investment strategist, sees the risks of recession rising and the dangers of debt and deficits growing.


Depending on how long the U.S.-China trade battle continues and the Fed continues raising rates, the two could jump back into the lead. Soybeans and corn should prosper, as well. Natural gas’ glory days may be ending.


#6 dTraderB

dTraderB

    Member

  • Traders-Talk User
  • 17,212 posts

Posted 15 December 2018 - 04:23 PM

And while markets may still see sizable rallies, the warning signs are still all around us, and they send a clear message: The 10-year bull market will come to an end, and the investing and trading climate is changing dramatically, possibly, for years to come.”

I don’t know the timing of when the bull market trend ends. It hasn’t yet, but it may also at any moment. For now we are in a complex corrective period, but in the article I’m outlining 6 specific risk factors that I think traders and investors need to watch closely in the year ahead.

No bull market lasts forever, that I am reasonably sure of, and currently markets are in stress and at risk of breaking their trend. The point here is not to point to doom and gloom, but to point to a changing investing and trading environment and to recognize when the bull trend is over, for when it is, things will change dramatically. Don’t forget: Even in bear markets there will be massive rallies and often these can be the most aggressive.

I repeat: The goal is not to be bullish or bearish. The goal is to be as realistic as possible in analyzing markets and identifying trade setups in either direction. And that is the biggest lesson on being wrong: Know when a setup is in your favor, know when it is invalid and move on. Rinse and repeat.

https://northmantrad...on-being-wrong/


#7 dTraderB

dTraderB

    Member

  • Traders-Talk User
  • 17,212 posts

Posted 15 December 2018 - 04:26 PM

No FED hikes in 2019?


  1. 3 replies0 retweets7 likes
    Reply
     3
     
    Retweet


    Like
     7
  2.  

    Douglas Kass Retweeted Paul Kessler

    Zero hikes in 2019 1-2% growth in real gdp first half 3q turns negative 4q recession


#8 dTraderB

dTraderB

    Member

  • Traders-Talk User
  • 17,212 posts

Posted 15 December 2018 - 04:39 PM

Weak FINANCIALS


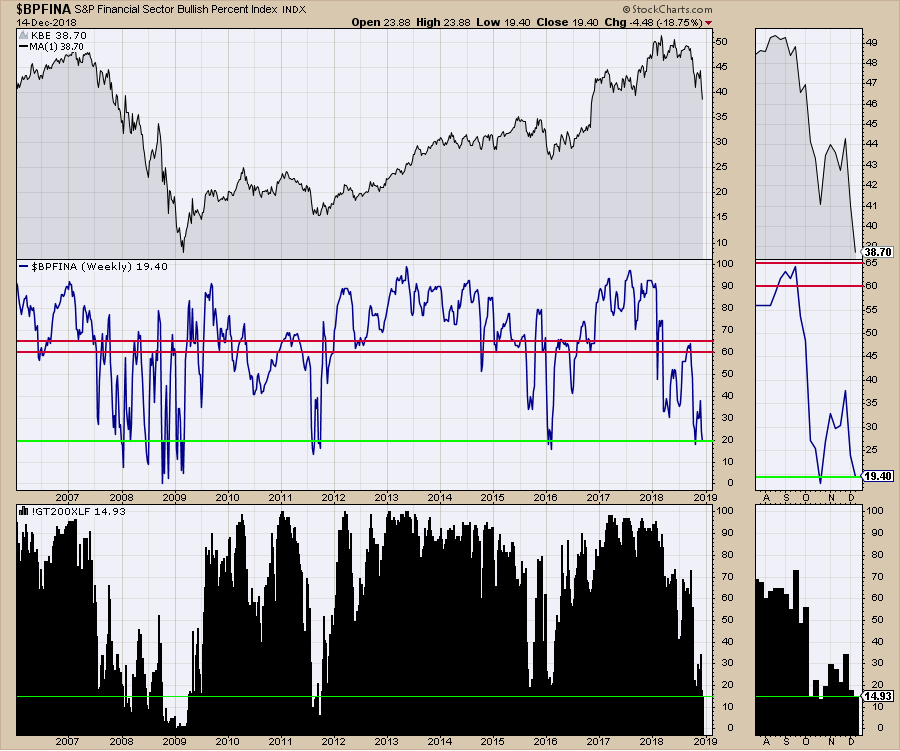
It looks like another tough month for the markets as year-end approaches. The index swings are getting increasingly aggressive and it feels like nearly every sector is getting yanked around. While there are lots of reasons to be bullish based on some of the "oversold" sentiment indicators, other reasons suggest a more worrisome stance.

In the chart below, the top panel shows the KBE Bank ETF, which has sold off by 25%. The dip isn't quite as big (in percentage terms) as the big dips of 2011 (42%) and 2016 (28%) were. 

Looking at the Financials Bullish Percent Index in the center panel, we can see that we are down near some of the big retracement levels. 2008 and 2016 reached these low levels close to the start of the new year.

The percentage of stocks above the 200-day moving average is shown in black on the bottom panel. When the market gets this weak, it typically needs more time to correct. 

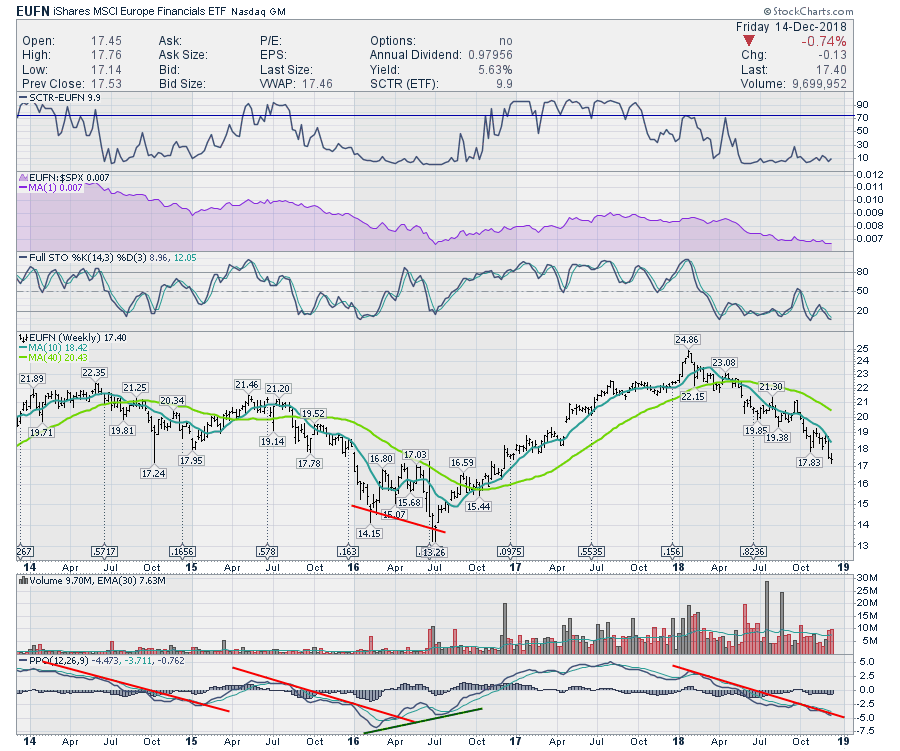
15448974220791825144923.pngCurrently, one of the big problems is that the global banking charts look terrible. As one of the New York-based technicians said, when the banking charts go bearish, that is when there are problems. The reason is that the bankers can see everyone else's books. The chart below shows the European Financials ETF. Even though there is no divergence on the chart yet, the ETF is off  30% from its highs. 

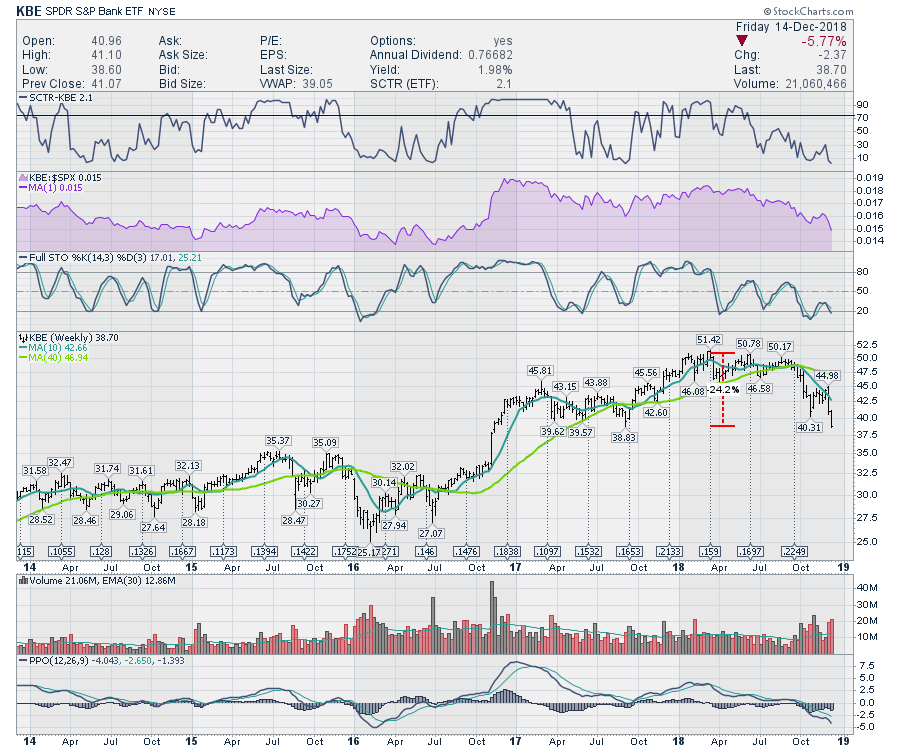
15448955522652027871465.pngThe US Bank charts have plummeted in the last 9 trading days. The KBE Bank ETF has sold off 13% in two weeks and is 24% off the high. Ouch!

1544895877347800791191.pngWhile the Fed has been raising rates, these US banks were coping in the first half of the year. However, this has clearly changed after the June highs, which was when the banks diverged from the $SPX. The Fed meeting on Wednesday, however, could cause a change in sentiment. The next 10 days will need a rally to turn the $SPX positive for the year.

https://stockcharts....more-time-.html


#9 dTraderB

dTraderB

    Member

  • Traders-Talk User
  • 17,212 posts

Posted 15 December 2018 - 04:40 PM

PMO Analysis - Wrong Direction and Not Oversold Enough Erin Swenlin | December 15, 2018 at 03:06 PM

The Price Momentum Oscillator (PMO) is great measure of acceleration/deceleration of price for individual entities, but combining each component's PMO readings within an index helps us to understand how overbought or oversold it is in three timeframes. While readings are oversold, they are still declining. This suggests that prices within the SPX, OEX and NDX are vulnerable to more downside price action. Let's review each of the panes below price. The first is the short-term indicator which measures whether a PMO is rising. For reference, you can look at the index's PMO to visualize. 


https://stockcharts....old-enough.html


#10 dTraderB

dTraderB

    Member

  • Traders-Talk User
  • 17,212 posts

Posted 15 December 2018 - 04:50 PM

"...I posted a set of charts comparing the indicator SPXA50R, which shows the percentage of stocks in the S&P 500 that are above their 50 day moving averages along with the SPX for comparison.  One thing that has occurred in the past is when a divergence forms where the $SPXA50R has a higher low while the SPX itself has a lower low, you tend to get some sort of rally.  This divergence doesn't tell you when that will occur but generally it occurs eventually.  The first chart shows the current chart with the divergence in place, where as the subsequent charts show examples from the past. 

The final chart shows a current chart of the SPX 500 without the indicator.  In the short term should price go lower there's the April low at 2553 and the Feb low at 2532."