
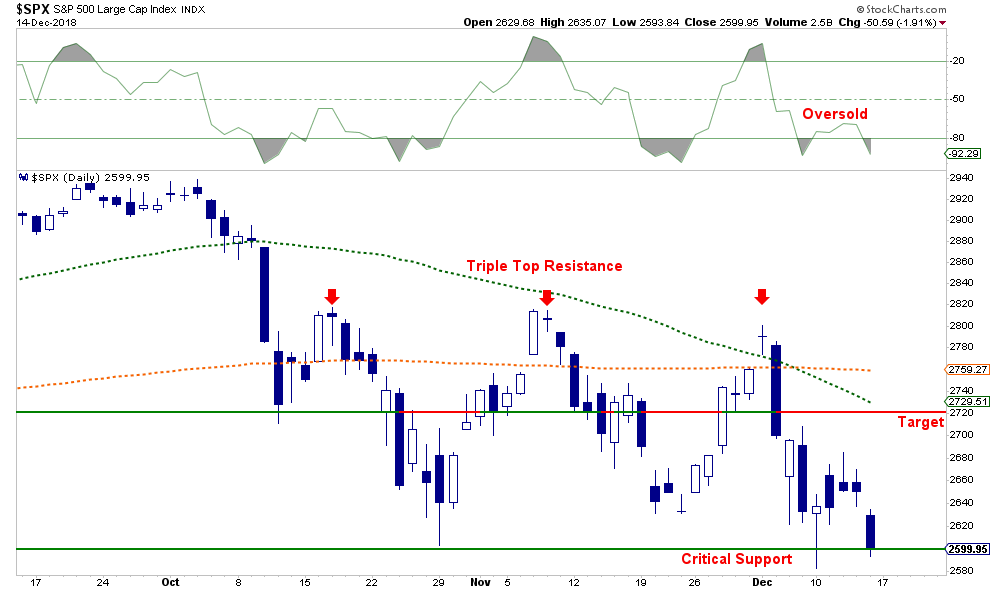
Last week, as we noted at RIA PRO, we put on a small S&P 500 (IVV) trading position for a potential oversold rally. As I noted on Friday, that trade has left much to be desired as the market simply has not been able to muster a sustainable bounce. On Friday, the market closed right at critical support levels.
Given the Fed meets next week, we are going to give our trade just the smallest margin of movement currently for three reasons:
- The market is deeply oversold which will contribute to a bounce on any bit of good news.
- The index closed lower than where it opened for 4-consecutive days. Such selling is often met with a one or two day bounce.
- Lastly, as noted previously, distributions for mutual funds are now mostly complete and they have to rebalance portfolios before the end of the reporting year. With next week having the highest historical probability for a rally, a more “dovish” than expected Fed could spark a bit of buying frenzy.
While we are expecting an oversold rally, remember after having reduced exposure in portfolios previously, and carrying a much heavier weighting in cash, we are giving the market time to figure out what it wants to do. Given the consolidation range over the last couple of months, it is too risky to be either overly short, or aggressively long, currently. Cash remains the best hedge currently.
But let me repeat the most important point:
“The expected rally IS NOT the next version of the ‘bull market.’ Nor does a rally mean the ‘bear market’ is over. It will be a counter-trend rally to sell into.”
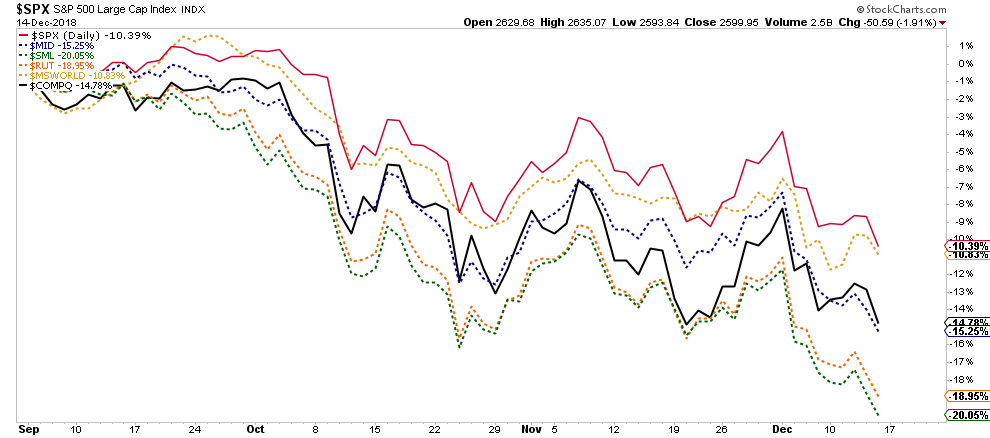
But it is not just the S&P 500 where this is occurring. As shown, every market is now trending negatively.
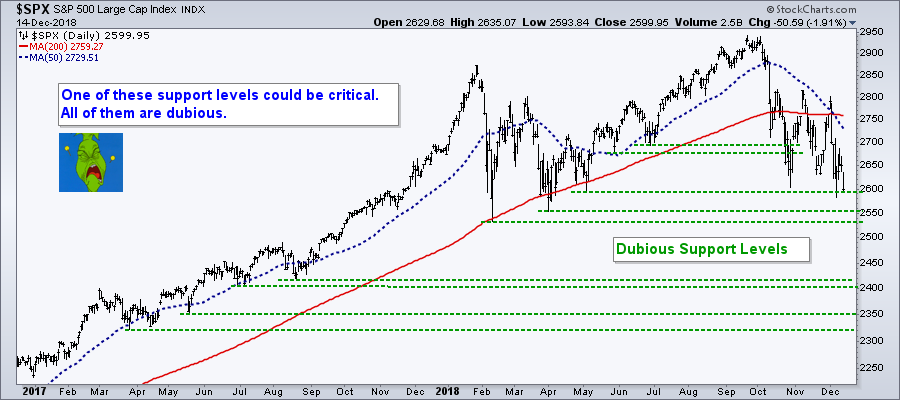
As I have noted previously, the weakness in the market continues to be a process that has gripped markets over the last several months as the Federal Reserve has steadily increased their extraction of liquidity. As shown in the chart above, the market has continued to build multiple tops as the 50-dma deepens its divergence from the 200-dma. Currently, downside stop losses are holding, but there isn’t much wiggle room here currently before further actions need to be taken.
While we are certainly hoping that Santa Claus will indeed come and visit “Broad & Wall” over the next two weeks, there isn’t much reason to take on an excessive amount of risk currently.
https://realinvestme...y-list-12-14-18
Last week, as we noted at RIA PRO, we put on a small S&P 500 (IVV) trading position for a potential oversold rally. As I noted on Friday, that trade has left much to be desired as the market simply has not been able to muster a sustainable bounce. On Friday, the market closed right at critical support levels.
Given the Fed meets next week, we are going to give our trade just the smallest margin of movement currently for three reasons:
- The market is deeply oversold which will contribute to a bounce on any bit of good news.
- The index closed lower than where it opened for 4-consecutive days. Such selling is often met with a one or two day bounce.
- Lastly, as noted previously, distributions for mutual funds are now mostly complete and they have to rebalance portfolios before the end of the reporting year. With next week having the highest historical probability for a rally, a more “dovish” than expected Fed could spark a bit of buying frenzy.
While we are expecting an oversold rally, remember after having reduced exposure in portfolios previously, and carrying a much heavier weighting in cash, we are giving the market time to figure out what it wants to do. Given the consolidation range over the last couple of months, it is too risky to be either overly short, or aggressively long, currently. Cash remains the best hedge currently.
But let me repeat the most important point:
“The expected rally IS NOT the next version of the ‘bull market.’ Nor does a rally mean the ‘bear market’ is over. It will be a counter-trend rally to sell into.”
But it is not just the S&P 500 where this is occurring. As shown, every market is now trending negatively.
As I have noted previously, the weakness in the market continues to be a process that has gripped markets over the last several months as the Federal Reserve has steadily increased their extraction of liquidity. As shown in the chart above, the market has continued to build multiple tops as the 50-dma deepens its divergence from the 200-dma. Currently, downside stop losses are holding, but there isn’t much wiggle room here currently before further actions need to be taken.
While we are certainly hoping that Santa Claus will indeed come and visit “Broad & Wall” over the next two weeks, there isn’t much reason to take on an excessive amount of risk currently.


