Jump to content


Photo

Market in danger of big decline below SPX 2500


  • Please log in to reply
19 replies to this topic

#1 dTraderB

dTraderB

    Member

  • Traders-Talk User
  • 17,167 posts

Posted 23 January 2019 - 06:59 PM

If the SHUTDOWN extends beyond the end of January the markets will drop like a stone!


Mulvaney asks for list of programs vulnerable to a lengthy shutdown
The Hill-1 hour ago
Mulvaney asks for list of programs vulnerable to a lengthy shutdown ... Mulvaneyhas asked for the information by Friday, a request that was ...


More later


#2 fib_1618

fib_1618

    Member

  • Traders-Talk User
  • 10,145 posts

Posted 23 January 2019 - 07:12 PM

Look for the shutdown to continue until Boris and Natasha squeal.


Fib


Better to ignore me than abhor me.

“Wise men don't need advice. Fools won't take it” - Benjamin Franklin


"Beware of false knowledge; it is more dangerous than ignorance" - George Bernard Shaw


Demagogue: A leader who makes use of popular prejudices, false claims and promises in order to gain power.

Technical Watch Subscriptions


#3 Tim Johnson

Tim Johnson

    Member

  • Traders-Talk User
  • 77 posts

Posted 23 January 2019 - 07:23 PM

Very unlikely the market is going to drop on February 1 because of the government shutdown. Have you noticed the rally since the shutdown?


#4 redfoliage2

redfoliage2

    Member

  • Traders-Talk User
  • 18,000 posts

Posted 23 January 2019 - 07:55 PM

The current market is news driven providing great opportunities for both bills and bears ..........

#5 dTraderB

dTraderB

    Member

  • Traders-Talk User
  • 17,167 posts

Posted 24 January 2019 - 06:04 AM

18 hours ago - White House economic advisor Kevin Hassett says U.S. GDP growth in the first quarter could be zero due to the government shutdown.


#6 dTraderB

dTraderB

    Member

  • Traders-Talk User
  • 17,167 posts

Posted 24 January 2019 - 06:51 AM

BloombergVerified account @business
FollowFollow @business
More

A growing number of federal workers are calling in sick or claiming hardship exemptions, testing the limits of strict laws against organized job actions


#7 dTraderB

dTraderB

    Member

  • Traders-Talk User
  • 17,167 posts

Posted 24 January 2019 - 06:56 AM

AAII Bulls up a smidge but pretty evenly divided bulls to bears. Bulls 37.7% Bears 32.3


McClellanOsc_463.gif


https://www.mcoscill...t_breadth_data/


Edited by dTraderB, 24 January 2019 - 06:57 AM.


#8 dTraderB

dTraderB

    Member

  • Traders-Talk User
  • 17,167 posts

Posted 24 January 2019 - 07:25 AM

McCullough: Earnings Season Will Be 'Major Negative'
Summary

Just 10% of S&P 500 companies have reported 4Q 2018 earnings.

So far, we've seen a slowdown relative to the previous quarter's 26% year-over-year growth.

“I think earnings season is going to be a major negative as we go throughout,” says Hedgeye CEO Keith McCullough.


https://seekingalpha...-major-negative


#9 dTraderB

dTraderB

    Member

  • Traders-Talk User
  • 17,167 posts

Posted 24 January 2019 - 07:28 AM

TIM ORD:

he seems to be looking for an ABC correction then UP & AWAY!


15482748369931412588821.gifThere is a confluence of Fibonacci levels of 50% and 61.8% retracement level at 2640 SPX range, which is where the November and December lows lie along with the 50-day moving average (not shown); all are resistance zones. An Elliott Wave five count up appears to have completed on Friday and an “ABC” correction could be in the making. The TICK closed at -122 and TRIN at 1.62 and, off tops, this reading can be a bearish short term sign, which can lead to another day or two of decline but not usually a big decline. The second window up from the bottom is the Cumulative TICK, with a 75-period moving average. The Cumulative TICK has moved down modestly, showing that momentum is weakening in the short term. If TICKs don’t explode negatively in the coming days, it could lead to a bullish setup.154827486976752389735.gifThe middle on the chart above is the NYSE McClellan Oscillator/VIX ratio. When this ratio has reached above +15 (going back 7 years), the market continued its rally in the following weeks. In 2013 (circled in red) there was a brief consolidation that lasted a couple of weeks; in the other cases, the market marched higher each time (other than a couple days' consolidation). As reported on last Thursday’s update quoted by Bullmarket.com, “For the 10th day in a row, the S&P 500 $SPX has closed higher than the daily OPEN. This has happened 10 other times from 1962-present, 9 of those 10 times saw the S&P higher 1 week later average gain of .29%.” Though the market was higher 90% of the time, the rally was only .29%. Trend is up.


https://stockcharts....ry-22-2019.html

15482748369931412588821.gifThere is a confluence of Fibonacci levels of 50% and 61.8% retracement level at 2640 SPX range, which is where the November and December lows lie along with the 50-day moving average (not shown); all are resistance zones. An Elliott Wave five count up appears to have completed on Friday and an “ABC” correction could be in the making. The TICK closed at -122 and TRIN at 1.62 and, off tops, this reading can be a bearish short term sign, which can lead to another day or two of decline but not usually a big decline. The second window up from the bottom is the Cumulative TICK, with a 75-period moving average. The Cumulative TICK has moved down modestly, showing that momentum is weakening in the short term. If TICKs don’t explode negatively in the coming days, it could lead to a bullish setup.154827486976752389735.gifThe middle on the chart above is the NYSE McClellan Oscillator/VIX ratio. When this ratio has reached above +15 (going back 7 years), the market continued its rally in the following weeks. In 2013 (circled in red) there was a brief consolidation that lasted a couple of weeks; in the other cases, the market marched higher each time (other than a couple days' consolidation). As reported on last Thursday’s update quoted by Bullmarket.com, “For the 10th day in a row, the S&P 500 $SPX has closed higher than the daily OPEN. This has happened 10 other times from 1962-present, 9 of those 10 times saw the S&P higher 1 week later average gain of .29%.” Though the market was higher 90% of the time, the rally was only .29%. Trend is up.


#10 dTraderB

dTraderB

    Member

  • Traders-Talk User
  • 17,167 posts

Posted 24 January 2019 - 07:31 AM

A Rare Evening Star Forms in QQQ
Arthur Hill |   

January 23, 2019 at 06:50 AM


1548243992258573272780.pngDespite a 15% surge the prior 17 days, the Nasdaq 100 ETF (QQQ) remains below its flattening 200-day SMA and the ETF formed a rare evening star candlestick pattern over the last three days.

First and foremost, I think the long-term trend is down for QQQ. The ETF recorded a 52-week low in December and remains below the 200-day SMA. Even though a 15% advance is impressive, this advance is still in the shadow of an even larger decline (-16.9%). The early December high marks the last peak where the bulls lost control and a break above this high is needed to reverse the bigger downtrend.

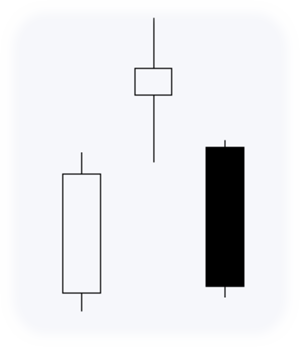
I am highlighting a bearish candlestick reversal because the bigger trend is down. Thus, it is in harmony with the bigger downtrend. I would not highlight this pattern if the bigger trend was up. The evening star pattern is a relatively rare three-candlestick reversal. It forms with a long white candlestick, a gap up and indecisive candlestick and then a gap down and long black candlestick. The bulls were in control with the long white candlestick. The middle candlestick shows indecision because the open-close range is small and in the middle of the high-low range. The bears took control with the third candlestick and forged a short-term reversal.

15482440483371748858096.png

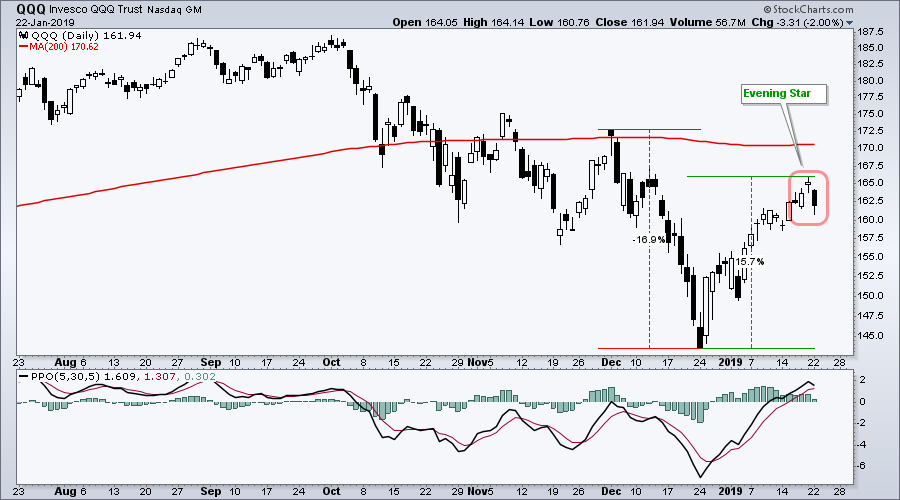
Now what? First, keep in mind that candlestick reversal patterns are short-term and only valid for a few days. Second, the other major index ETFs (SPY, IWM) did not form evening star reversal patterns, even though they also fell on Monday. The evening star in QQQ provides the first sign that the big counter-trend bounce is ripe for a rest or even a reversal. The indicator window shows the PPO (5,30,5) still above its signal line so momentum has yet to turn. Watch for a move below the signal line for further confirmation of a short-term downturn.  You can also find evening star patterns on our Predefined Scan Page.

https://stockcharts....rms-in-qqq.html

The middle on the chart above is the NYSE McClellan Oscillator/VIX ratio. When this ratio has reached above +15 (going back 7 years), the market continued its rally in the following weeks. In 2013 (circled in red) there was a brief consolidation that lasted a couple of weeks; in the other cases, the market marched higher each time (other than a couple days' consolidation). As reported on last Thursday’s update quoted by Bullmarket.com, “For the 10th day in a row, the S&P 500 $SPX has closed higher than the daily OPEN. This has happened 10 other times from 1962-present, 9 of those 10 times saw the S&P higher 1 week later average gain of .29%.” Though the market was higher 90% of the time, the rally was only .29%. Trend is up.