Jump to content


Photo

ST flat, IT short, bulls battle back from the edge of the abyss


  • Please log in to reply
17 replies to this topic

#1 dTraderB

dTraderB

    Member

  • Traders-Talk User
  • 17,282 posts

Posted 10 February 2019 - 11:50 AM

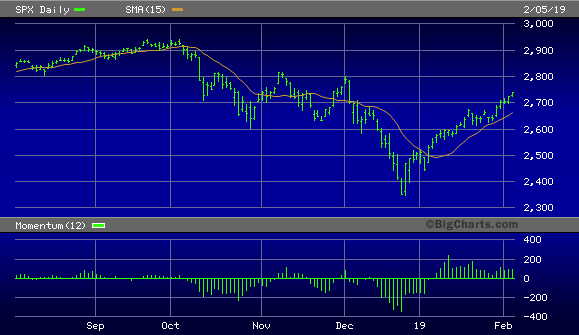
The charts don't lie, they are for real, and it does show the bulls have come back from the brink on 2 successive days to take the SPX back above the 2700 level. Candle experts say those are two bullish candles and the hourly candle chart is also quite bullishly impressive.


But, for now, the bears are still holding the edge once SPX daily does not close above the 200ma level. Essentially, this has been a pitched battle for control of the SPX 2700 to 2740 zone and who wins it will control the market for at least a 5% move 


BTW, this was actually still an UP week for SPX!   OPEX week can be quite volatile (bring it on!) and it can get really wild with trade war negotiations, shutdown threat (again!), and assorted political gyrations. But, who is complaining, this is what we dream of!


Magic

magic.jpg?resize=179%2C112&ssl=1
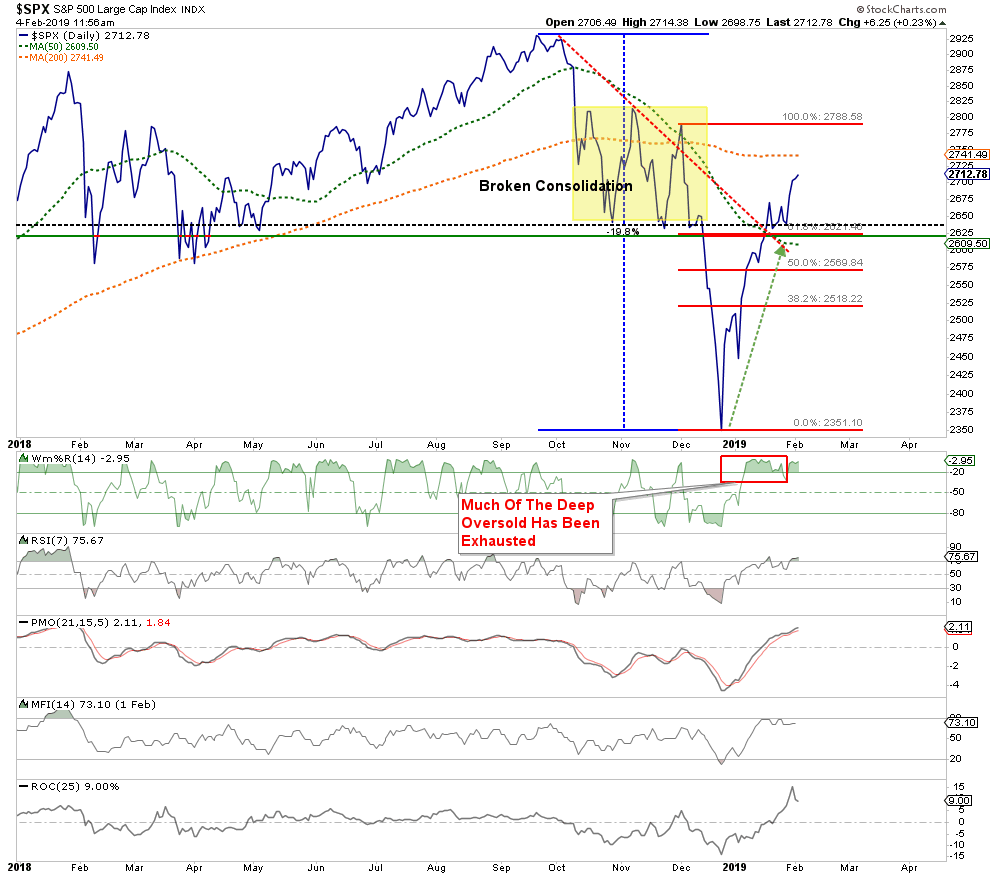
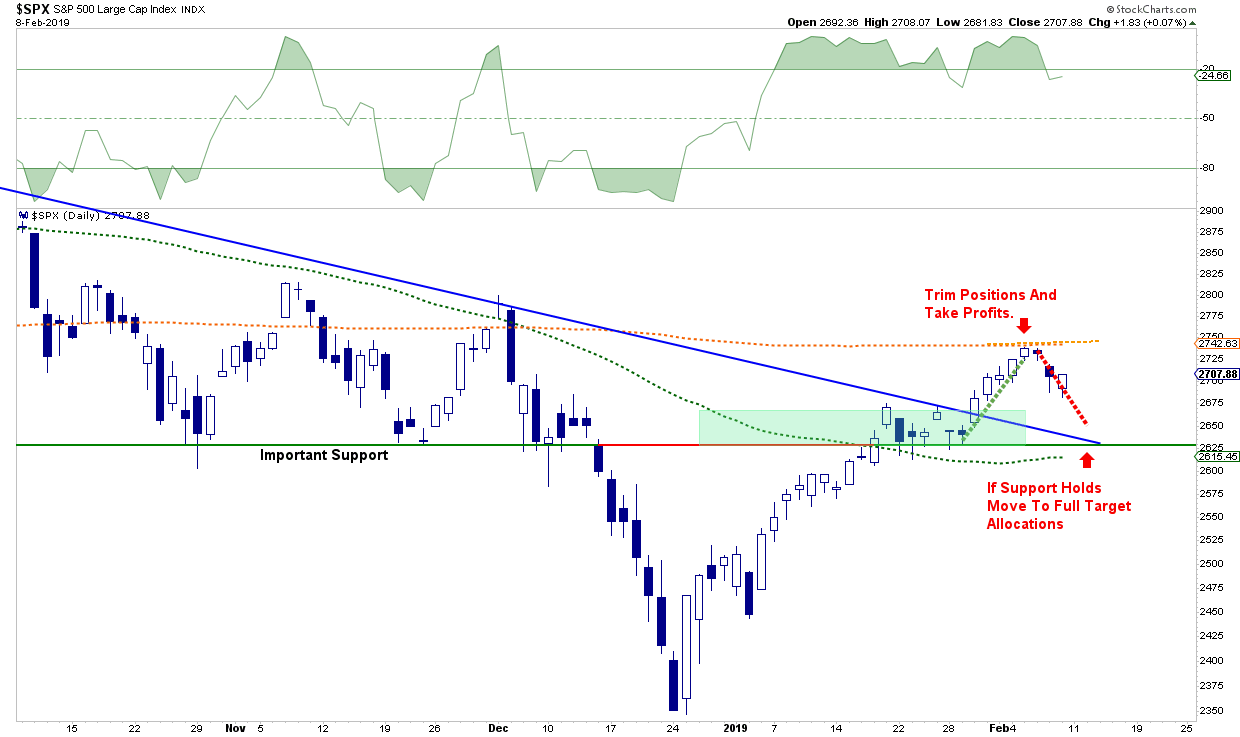
This week markets reached the key resistance confluence zone I’ve been outlining and rejected from there. Still $SPX managed to close the week positively by 1 handle making it the 7th consecutive week of uninterrupted gains. Whether this rejection is meaningful remains unproven at this stage. From my perch price discovery remains engaged in a battle for control between 2600 and 2730-2760 on $SPX.  This aggressive rally has achieved what it was technically meant to: Reconnect with moving averages and achieve balance.

But for now it remains a rally below the 200 daily moving average:

SPX200-5.png?resize=639%2C361&ssl=1

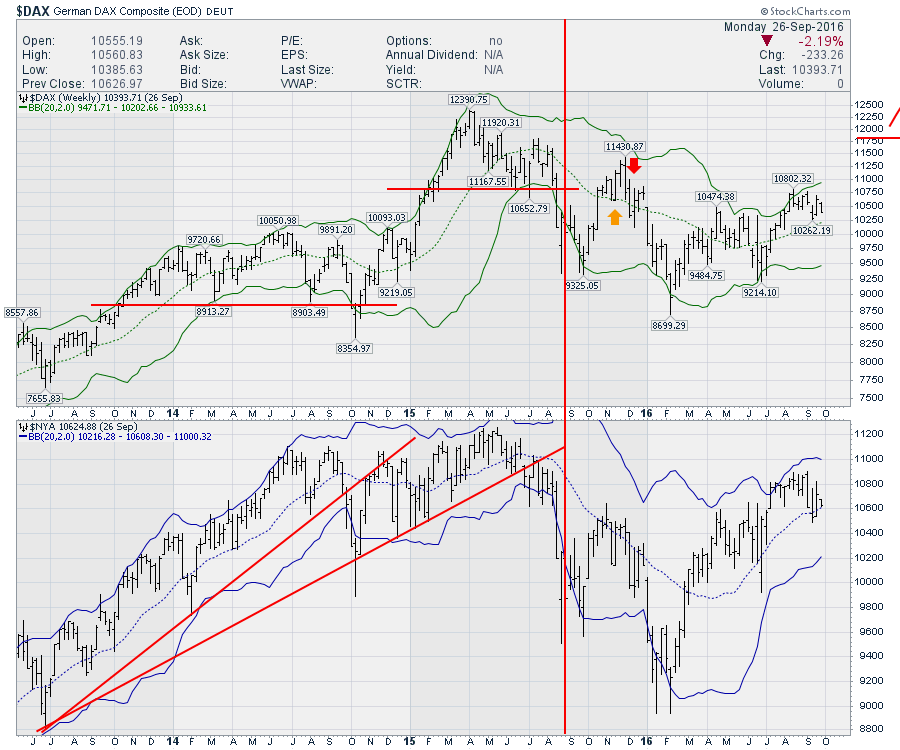
It remains a rally below the weekly 50MA:

SPXw-2.png?resize=639%2C478&ssl=1

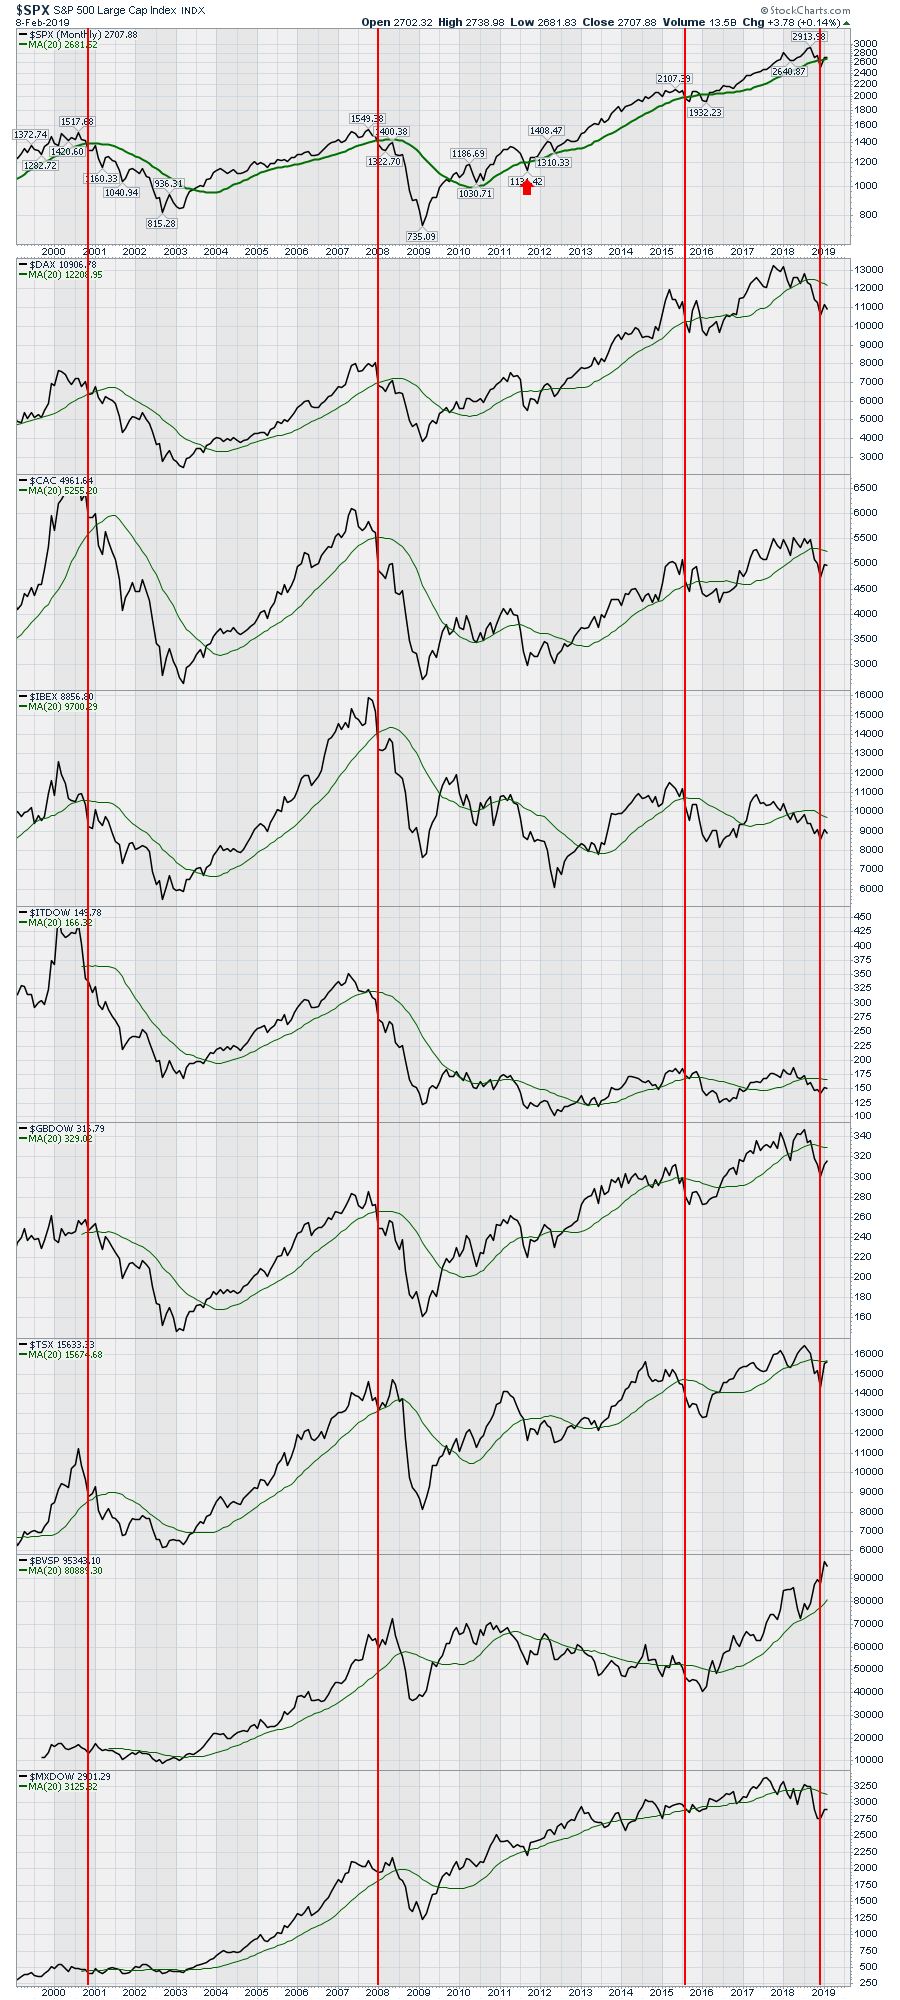
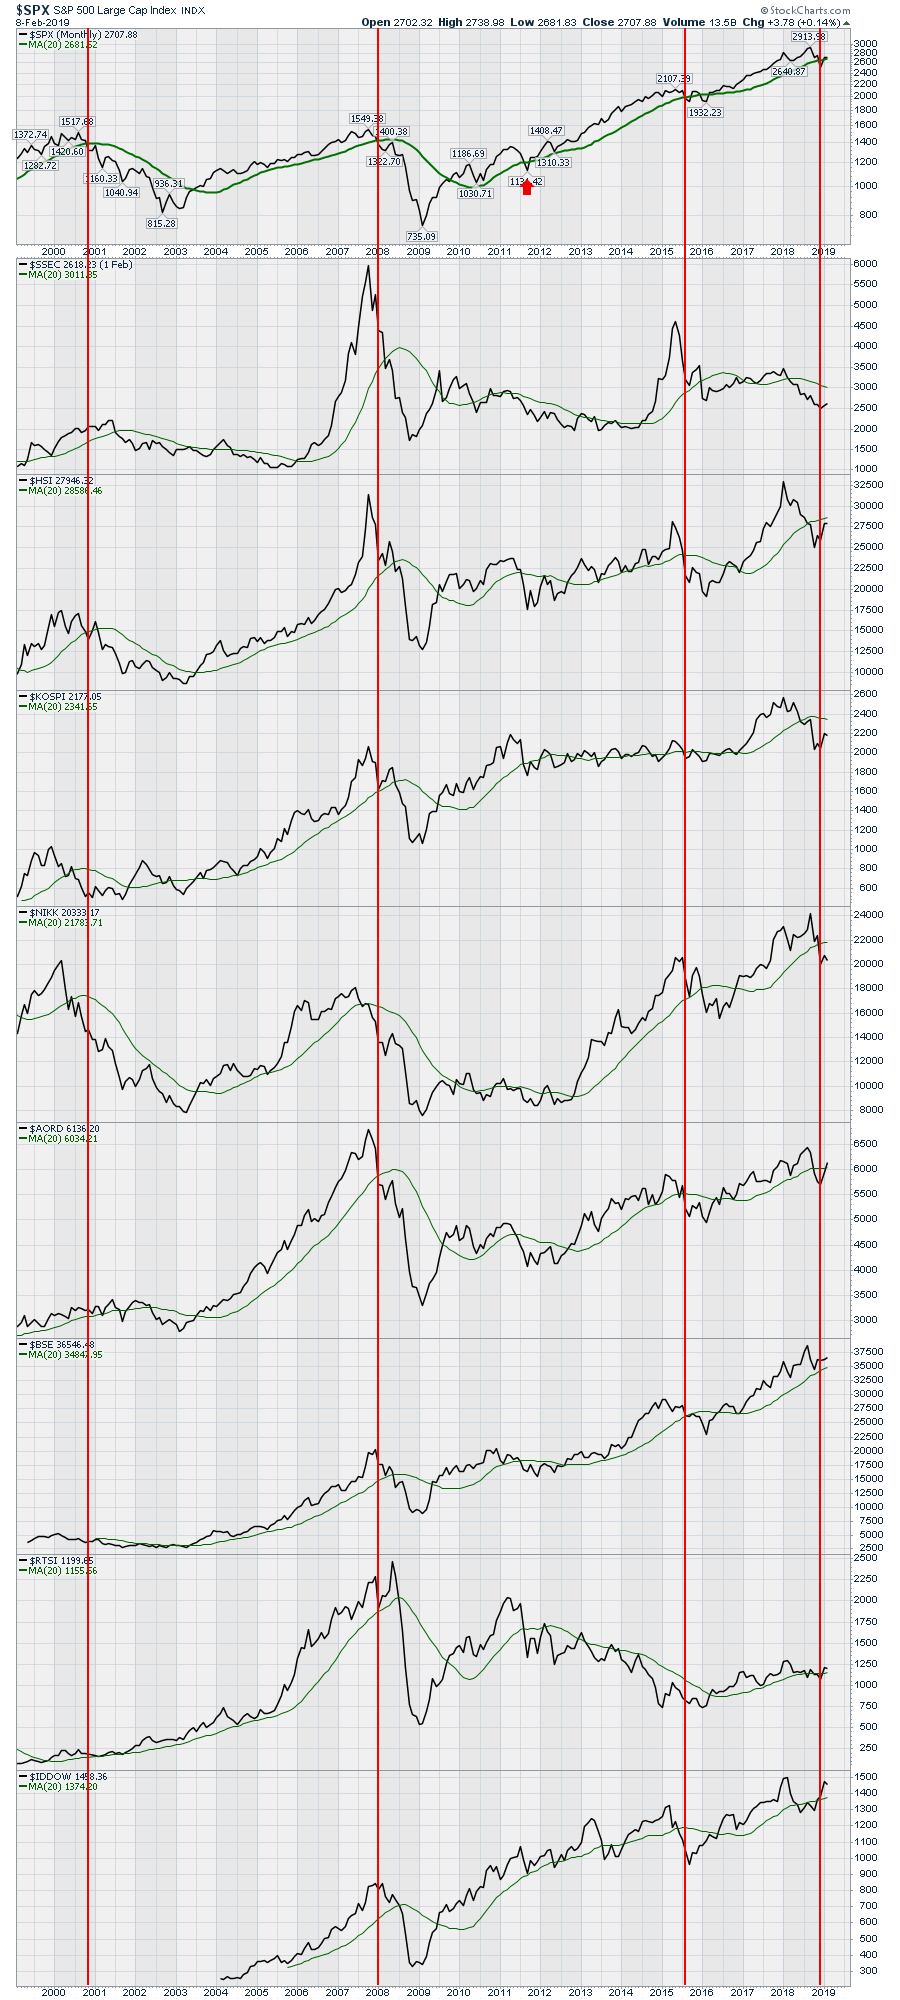
And it remains a rally below the monthly 15MA:

SPX15M.png?resize=639%2C379&ssl=1

And hence the larger potential bull trap structure remains in play for now:

SPXMmacro.png?resize=639%2C703&ssl=1

$DJIA failed to recapture its broken 2016 trend line:

DJIAW-2.png?resize=639%2C379&ssl=1

Yet fact remains that ever since the big central bank capitulation of 2019 markets have not had a single down week. It’s almost magical.

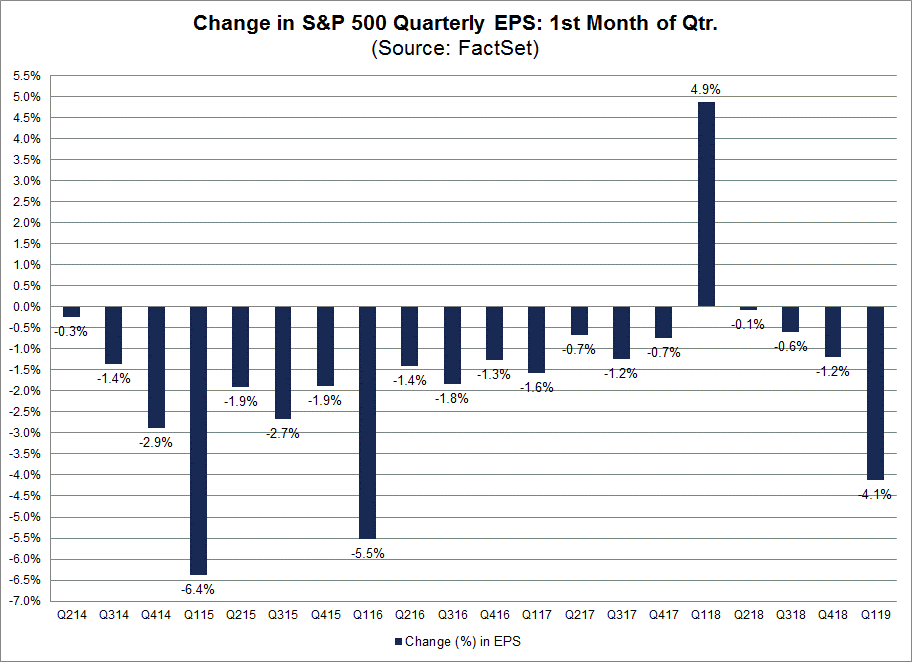
Indeed markets keep rising as earnings estimates keep coming down.  Per Factset: “$SPX is projected to report a year-over-year decline (-1.7%) in earnings for Q119, with 7 of 11 sectors expected to report a decrease in earnings. $SPX EPS estimate for Q119 has declined by 4.8% over the past 12 months and by 5.4% since Dec. 31.”


#2 dTraderB

dTraderB

    Member

  • Traders-Talk User
  • 17,282 posts

Posted 10 February 2019 - 11:55 AM

While I am not suggesting that the markets are about to suffer a 10% correction, what I am suggesting, as I wrote this past week, is that the markets have been "Too Fast & Too Furious."

"Short-term technical indicators also show the violent reversion from extreme oversold conditions back to extreme overbought."


saupload_SP500-OB-OS-020419_thumb1.png


As we have discussed previously, price movements are very much confined by the "physics" of technicals. A couple of weeks ago, we drew out what we expected to be the movement over the market over the next couple of weeks.


We said then the most likely target for the rally was the 200-dma. It was essentially the level at which the "irresistible force would meet the immovable object."

The chart below is updated through Friday afternoon:

saupload_SP500-Chart5-020819_thumb1.png

As noted, we lifted profits at the 200-dma and added hedges to the Equity and Equity Long/Short portfolios.

What will be critically important now is for the markets to retest and hold support at the Oct-Nov lows which will coincide with the 50-dma. A failure of that level will likely see a retest of the 2018 lows.

A retest of those lows by the way is not an "outside chance." It is actually a fairly high possibility. A look back at the 2015-2016 correction makes the case for that fairly clearly.

https://seekingalpha...mmovable-object


#3 dTraderB

dTraderB

    Member

  • Traders-Talk User
  • 17,282 posts

Posted 10 February 2019 - 01:19 PM

Agree with this; the FED is not crawling back to QE from QT, and from hiking to no rates, all withing a few weeks, because the President is "pressuring" them.  They have seen and/or know something is wrong under the hood and are trying to ensure they are prepared to deal with it.  


The Fed Is Watching The Stock Market - And That Could Mean Trouble

Thus, FOMC members likely changed their plans for future rate hikes because they were concerned about the effects falling stock prices would have on consumer and business confidence and, therefore, spending and economic growth.

Cieslak and Vissing-Jorgensen present another finding, however, that raises a potential concern with the FOMC's response to stock prices. Specifically, they discover that while the FOMC often makes its policy more accommodative after the stock market declines, it does not respond symmetrically by making its policy more restrictive when the stock market rises. This raises the concern that, deliberately or not, the Fed is giving investors a free "put" - that is, a way to cut their losses when stock prices fall without having to sacrifice any gains when stock prices rise.

It can be difficult for policymakers to stand by and watch the price of shares, or any other financial asset, fall suddenly in the free market, especially when it seems like their policies were the cause. But this is something that FOMC members may have to force themselves to do sooner or later. If they continue to respond asymmetrically to falling but not rising stock prices, they will encourage the same kind of excessive risk-taking that fueled the housing market bubble in the years leading up to the financial crisis of 2007-2009. Surely, this is something to be avoided.


https://seekingalpha...et-mean-trouble


#4 dTraderB

dTraderB

    Member

  • Traders-Talk User
  • 17,282 posts

Posted 10 February 2019 - 01:24 PM

CARL's potential NOBEL PRIZE theory:

I have a theory about the market that I'm thinking of tuning up for submission to the Nobel Prize committee. It goes like this: (1) Things get better and better until they are as good as they are going get. (2) Then they get worse and worse until they're as bad as they are going to get. (3) Repeat cycle. The only problem with this theory is that we never know for sure where the extreme limit for the current cycle will be, but it is still useful to keep in mind as we listen to news about how really good or really bad things are at a given time.

In his Thoughts from the Frontline last week John Mauldin included a chart of the unemployment rate versus the stock market. I thought it tied in nicely with my Nobel idea, and StockCharts.com has the data I need. Note how market tops tend to occur when unemployment is low -- both stock prices and unemployment are as good as they're going to get. The reverse is true when unemployment is high, but it is particularly difficult to know how high unemployment will get in a particular cycle.

1549651175290881632743.png

 The point here is that we appear to be in the negative side of the cycle, where unemployment will work its way higher and stocks will move lower. To clarify, I do not think that unemployment drives stock prices, or vice versa, but a low unemployment rate does give us a clue as to when things are about as good as they are going to get.


#5 dTraderB

dTraderB

    Member

  • Traders-Talk User
  • 17,282 posts

Posted 10 February 2019 - 01:26 PM

There is greed, but not extreme, as during last January:


https://money.cnn.co...fear-and-greed/


McOs nearing ZERO:


McClellanOsc_475.gif


https://www.mcoscill...t_breadth_data/


#6 dTraderB

dTraderB

    Member

  • Traders-Talk User
  • 17,282 posts

Posted 10 February 2019 - 02:34 PM

Germany & Europe weakness


In 2015, the German market made a 3-week low without the USA (orange arrow). Both Germany and the US went on to rally for two more weeks, then rolled over hard (red arrow). The final top was just as the US market moved above the 20-week moving average.

15498183596541612123515.pngWhile Germany is just one market, there are lots of breakdowns out there. In the October 2018 article, I had two vertical charts comparing some notable world markets. Here are those two charts updated to the current level, including the big rally. 11 of those 17 markets are still below the 20-month moving average, including major trading partners like Germany, France, Canada, UK, Mexico, China and Japan.

15498188413761620404178.pngHere's a chart looking at east Asian countries.

1549819053600345647470.png

All this is to say it's not just Germany. History doesn't necessarily repeat exactly, but it often rhymes. There are some powerful charts worth looking at in this article: Give Your Charts A Shake 2019-02-09.

https://stockcharts....h-watching.html


#7 dTraderB

dTraderB

    Member

  • Traders-Talk User
  • 17,282 posts

Posted 10 February 2019 - 02:38 PM

The Global Slowdown Could Soon Hit Home
  •  
  •  
  •  
  •  
By 
Randall W. Forsyth
Feb. 8, 2019 8:41 p.m. ET

Amid these signs of sputtering growth, the U.S. Treasury 10-year yield dropped to a 13-month low of 2.63% while short-term borrowing costs eased, in effect undoing half of the Federal Reserve’s December 25-basis-point interest-rate hike. And while the major U.S. stock market gauges extended their advance over the past seven weeks, last week saw a trivial gain of less than 1%, reflecting a midweek swoon over global growth worries.

The equity market’s rise over that span can be viewed as a relief rally following December’s swoon, as the Fed shifted last month to a “patient” stance regarding future rate increases and greater potential flexibility about shrinking its balance sheet. While that attitude adjustment bolstered bullishness in the equity markets, Peter Boockvar, chief investment officer at Bleakley Advisory Group, observed that the decline in global bond yields in reaction to slower growth should remind investors why the Fed altered its stance in the first place.

EDITORS'  
 

Politics continue to hang over the markets as well, with another possible federal government shutdown looming on Friday. There’s little expectation of a replay of the previous shutdown fiasco, given that nobody gained anything from it. Markets were also upset by President Donald Trump’s admission that he won’t be getting together with President Xi Jinping of China before the March 1 deadlinefor the increase in tariffs on $250 billion of Chinese goods to 25% from 10%. While the timing of the eventual meeting of the leaders of the world’s two biggest economies may be uncertain, Cowen’s Washington watcher Chris Krueger predicts a “huge victory for Trump.”

The most recent monthly U.S. trade data show why further curbs are in nobody’s interest. The U.S. deficit shrank to $49.3 billion in November from $55.7 billion in October, which would mathematically boost fourth-quarter GDP (currently estimated to have grown at a 2.4% annual rate). But the smaller shortfall was due to a 2.9% drop in imports, a sign of slower U.S. demand, while exports fell 0.6%, reflecting sluggish demand abroad.

MORE UP & DOWN WALL STREET


“The U.S. economy still appears to be sailing on serenely while the rest of the world economy sinks like a stone,” write the forecasters at Capital Economics. America remains a relatively closed and service-oriented economy, but the advisory firm suggests that eventually what’s happening overseas won’t stay there. That suggests the Fed’s patience is prudent, it concludes. But that may not be sufficient to spur gains in risky assets beyond the rebound seen since December’s debacle.

Write to Randall W. Forsyth at randall.forsyth@barrons.com

https://www.barrons....u-s-51549676496


#8 dTraderB

dTraderB

    Member

  • Traders-Talk User
  • 17,282 posts

Posted 10 February 2019 - 02:43 PM

The Fed Fuels Stocks’ Dizzy Ride
  •  
  •  
  •  
  •  
By 
Randall W. Forsyth


https://www.barrons....isk-51549046877


#9 dTraderB

dTraderB

    Member

  • Traders-Talk User
  • 17,282 posts

Posted 10 February 2019 - 02:45 PM

WHAT????  Back to SPX 2350?


$VIX 50+ Target
$VIX 50+ Target. Do I have your attention? What I’m about to share is not my chart, it’s the Vixen’s chart. And when she posts charts of the $VIX I’ve learned to pay attention as she’s shown time and time again the $VIX can be charted.

Mella is famous for keeping things simple stupid (KISS). When it comes to markets she doesn’t care about the news, the noise, etc, she just charts. Mella was a long time market bull that turned bearish in 2018 and for good reason as all her bullish $VIX patterns have come to fruition.

And now she’s spotted another bullish $VIX pattern. A very bullish $VIX pattern.

In this case she’s seeing a massive potential inverse pattern on the $VIX. Now with all patterns they are potential patterns until they are confirmed, but this is a pretty impressive looking pattern and it’s massively bullish $VIX:

VIX-inverse.png?resize=639%2C313&ssl=1

So that big market rally from December into early February? It has built a right shoulder on the VIX. It’s a weekly chart and hence it doesn’t give you a due date, but while this pattern is not confirmed until it breaks above the neckline, it also very much remains a potential active patterns as it has not been invalidated.

What’s this pattern really say? It says that markets are at risk of a major risk off event sometime in 2019.

It doesn’t tell you when, but, if it happens, don’t be surprised that it did. Because it was in the charts. I, for one, will keep a close eye on this chart in 2019.


#10 dTraderB

dTraderB

    Member

  • Traders-Talk User
  • 17,282 posts

Posted 10 February 2019 - 02:55 PM

A BULLISH opinion, it does agree with my 2019 SPX high at 2800


Despite the solid technical and fundamental evidence that this market is firmly in the bulls’ control, many bearish analysts can’t resist the temptation to assume a worst-case scenario. Another recent example of this is found in a widely circulated online article discussing the possibility that stocks are in a “bull trap.” The article also mentioned the oft-repeated observation that today’s market is similar to the 2000 and 2007 peaks, even though the market’s internal profile (as mentioned above) is far stronger now than it was prior to the 2000 and 2007 tops.

A big reason then why investors are sleeping on this market is because they believe that the rally since December has exhausted its upside potential. This is a common belief whenever a market has seen a major decline, then rallied to a benchmark price level. In this case, the nearest benchmark for the SPX is the 2,800 level. The 2,800 level shows up as having technical significance in the following graph, for the area immediately around this level is where the SPX encountered strong resistance during the month of November. In fact, two rally attempts at that time were turned back at the 2,800 level in November and led to the bears completing their takeover of the market trend prior to the December plunge.

973376-15494058647012043.png

Source: BigCharts

As technical traders are well aware, price levels which formerly served as “resistance” to a rally tend to have significance whenever they are tested again. Since the SPX is well on its way to test the 2,800 level, investors can expect some degree of psychological reaction as this level is approached. That is, some participants will be taking profits when this level is reached while others will no doubt initiate short positions on the assumption that 2,800 is an insurmountable obstacle. This would be a mistake, however, based on the powerful internal momentum reflected in this market and discussed here. While the SPX may initially encounter resistance at 2,800 and temporarily pull back, I expect the index to eventually propel above this level and continue its climb to the late September high.


Market technicians aren’t the only ones sleeping on the stock market’s growth potential, however. Even research analysts have lowered earnings estimates for S&P 500 companies for the first quarter of 2019. According to a FactSet report:

The Q1 bottom-up EPS estimate (which is an aggregation of the median EPS estimates for all the companies in the index) dropped by 4.1% (to $38.55 from $40.21) during this period.”

This represents the biggest decline in the bottom-up EPS estimate during the first month of a quarter since the 5.5% drop in estimates during Q1 2016, according to FactSet. It should be noted, however, that earnings estimates for Q1 2019 have been declining in the last few months. It’s also worth mentioning that there hasn’t been a year-over-year decline in S&P 500 earnings since Q2 2016.

973376-15494058200285568.pngSource: FactSet

If nothing else, the bearish skew in analysts' estimates for S&P 500 companies lowers the bar for even more earnings surprises in the next quarterly earnings season. Analysts have been consistently underestimating the earnings growth potential for companies in the last several months, and the near future should prove to be no exception as earnings and revenue growth remains strong, with the S&P 500 enjoying its best January in 30 years.

In closing, I can only continue emphasizing that as long as corporate fundamentals remain strong and the NYSE internal indicators - including the advance-decline line and new high/new low ratio - are in a rising trend, investors are justified in leaning bullish. Based on the evidence which we’ve discussed here, it would be a mistake to underestimate this market’s upside potential, and an even bigger mistake to sell this market short.

https://seekingalpha...sleeping-market