Jump to content


Photo

TIM ORD: "in the very short term, a pullback is likely"


  • Please log in to reply
19 replies to this topic

#1 dTraderB

dTraderB

    Member

  • Traders-Talk User
  • 17,285 posts

Posted 13 February 2019 - 03:21 PM

He seems to be neutral to short, closing a LONG position. 
I am also thinking the same, a bit more bearish.  My CM indicator says the rally is running on fumes but 

I know that such rallies can run for a while, in this case, to SPX 2800 or just above it. But, this looks like another case where my CM (Common Sense) indicator is right.


SPX Monitoring purposes; Sold SPX on 2/12/19 at 2744.73 gain 1.36%; long 2707.89 on 2-8-19.
Monitoring purposes GOLD: Long GDX on 1/29/19 at 21.96.
Long Term Trend SPX monitor purposes; Long SPX on 10-19-18 at 2767.78
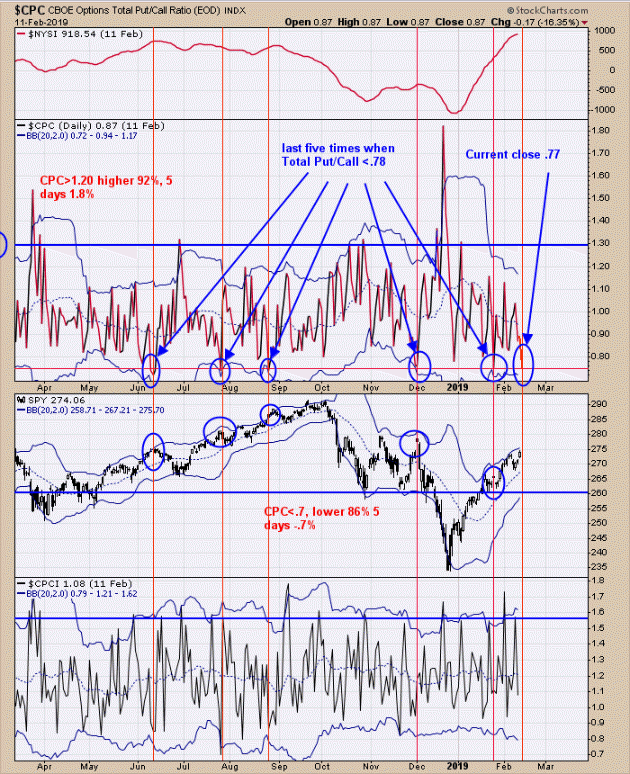
15500855323791953693104.gifYesterday we said, “First upside resistance is last Tuesday’s high of 2739 and next higher resistance is 2800 SPX, which is November and December high.” We where thinking that we'd get to the 2800 level, and we may still, but in the very short term, a pullback is likely. SPX closed the day at 2744.73, just above the previous high of 2738.98. The chart above is the Total Put/Call ratio (CPC) going back nearly a year, showing the times when this ratio reached .78 or lower (today’s close was .77).  As you can see from the chart, all were at a high for at least a day; some marked highs that lasted a week or more. The top window is the NYSE McClellan Summation index, which has reached +900 - previous times it has reached +900, a consolidation appeared that lasted two weeks, and something like that may be developing here. We sold our long position for a gain of 1.36%.  We will wait for the next setup.
1550085552652774396524.gif

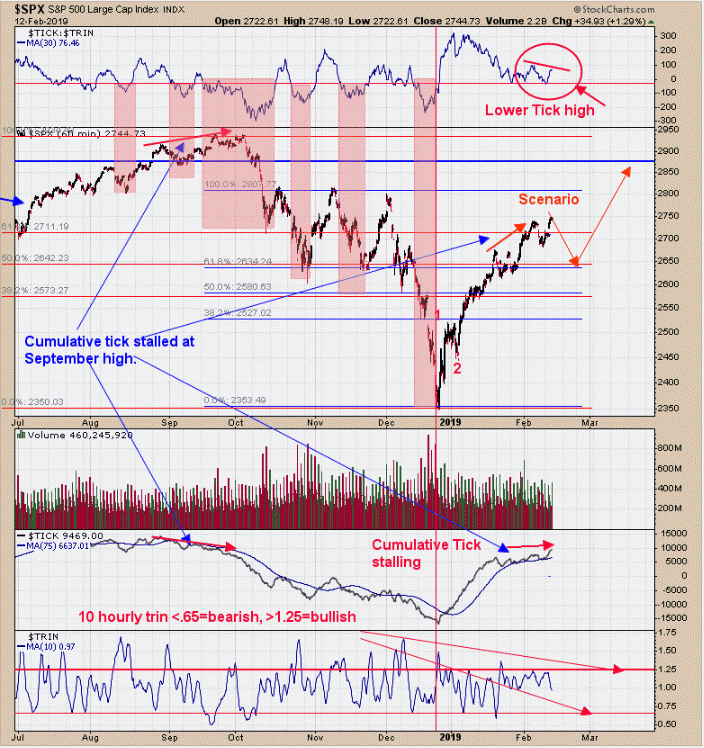
Last Thursday we said, “Since mid January, the SPX has pushed modestly higher and the Cumulative TICK flipped sideways, indicating upside momentum is weakening. Market has been up five days in a row going into this Tuesday and 97% of the time it will hit a higher high within five days.” Today is day number 5 and the market has hit a higher high, keeping its promise that market should be higher within five days. The cumulative TICK (second window up form the bottom) has made a higher high, suggesting the SPX rally may continue.  However, the steepness of the uptrend has weakened over the last couple of weeks, which is a negative in the intermediate-term. The top window is the 30-period moving average of the TICK, which has made a lower high as the SPX made a higher high and a short-term divergence. With this divergence and CPC reaching bearish levels, we elected to sell our long SPX position. President's Day is next Monday and markets are closed. It common for markets to reverse around holiday periods. Volume usually lessens as a holiday nears as traders take off early for the extended weekend and volume decreases. Volume decrease on a rally phase is usually a bearish sign and a declining phase is a bullish sign. Not sure what the next three days will bring, so back to neutral for now.

https://stockcharts....ry-12-2019.html


#2 q4wer

q4wer

    Member

  • Traders-Talk User
  • 2,179 posts

Posted 13 February 2019 - 03:22 PM

Long Term Trend SPX monitor purposes; Long SPX on 10-19-18 at 2767.78


He is long term under water.


#3 dTraderB

dTraderB

    Member

  • Traders-Talk User
  • 17,285 posts

Posted 13 February 2019 - 04:19 PM

Long Term Trend SPX monitor purposes; Long SPX on 10-19-18 at 2767.78


He is long term under water.


I only follow his ST term trades!


LOL


He has a slightly different take on the TICK & CPC


#4 dTraderB

dTraderB

    Member

  • Traders-Talk User
  • 17,285 posts

Posted 14 February 2019 - 06:29 AM

The stock market just cleared a key hurdle: 'It should open the door to 2,800 now'
  • Technical strategists, who focus on the charts more than headlines, see a number of more bullish signs for stocks.
  • For one, the S&P 500 closed on Tuesday above a key technical level that signals good momentum and further gains.
  • But there are other assets and markets moving in tandem, and strategists are watching a reversal in Shanghai stocks and gains in the semiconductor sector that could also be sending a positive message about the market and global economy.


https://www.cnbc.com...the-charts.html


#5 dTraderB

dTraderB

    Member

  • Traders-Talk User
  • 17,285 posts

Posted 14 February 2019 - 06:36 AM

Charlie BilelloVerified account @charliebilello
FollowFollow @charliebilello
More

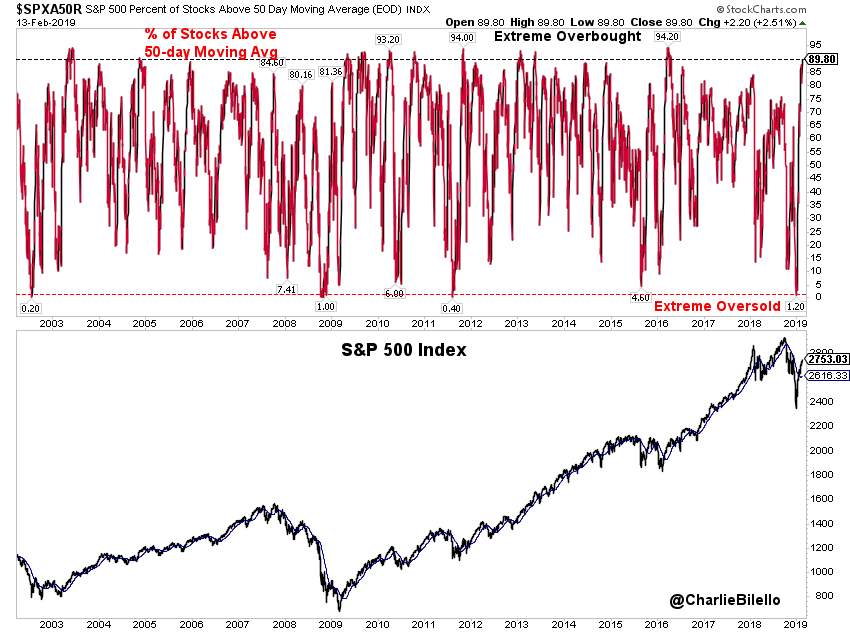
On Dec 24, only 1% of stocks in the S&P 500 closed above their 50-day moving avg, one of the most extreme oversold levels in history. After a 17% vertical rally, that number now stands at 89.8%, highest since April 2016 & in 97th percentile of historical readings. $SPX

DzVxSsMXQAAhxXg.png
8:44 PM - 13 Feb 2019


#6 dTraderB

dTraderB

    Member

  • Traders-Talk User
  • 17,285 posts

Posted 14 February 2019 - 06:43 AM

Martin Pring @martin_pring
FollowFollow @martin_pring
More
Replying to @McClellanOsc

@McClellanOsc 's Ratio-Adjusted Summation Index is nearing +1000 today . In the last 20 years the only other time it has moved directly from -1000 to +1000 was the March 2009 bottom. In January 2016 it bottomed around -800 -> +1200 (same magnitude but from a higher start point)

DzUwF6PUcAE1VNr.png
3:59 PM - 13 Feb 2019


#7 dTraderB

dTraderB

    Member

  • Traders-Talk User
  • 17,285 posts

Posted 14 February 2019 - 06:45 AM

Nice charts! 


 Tom McClellan Retweeted

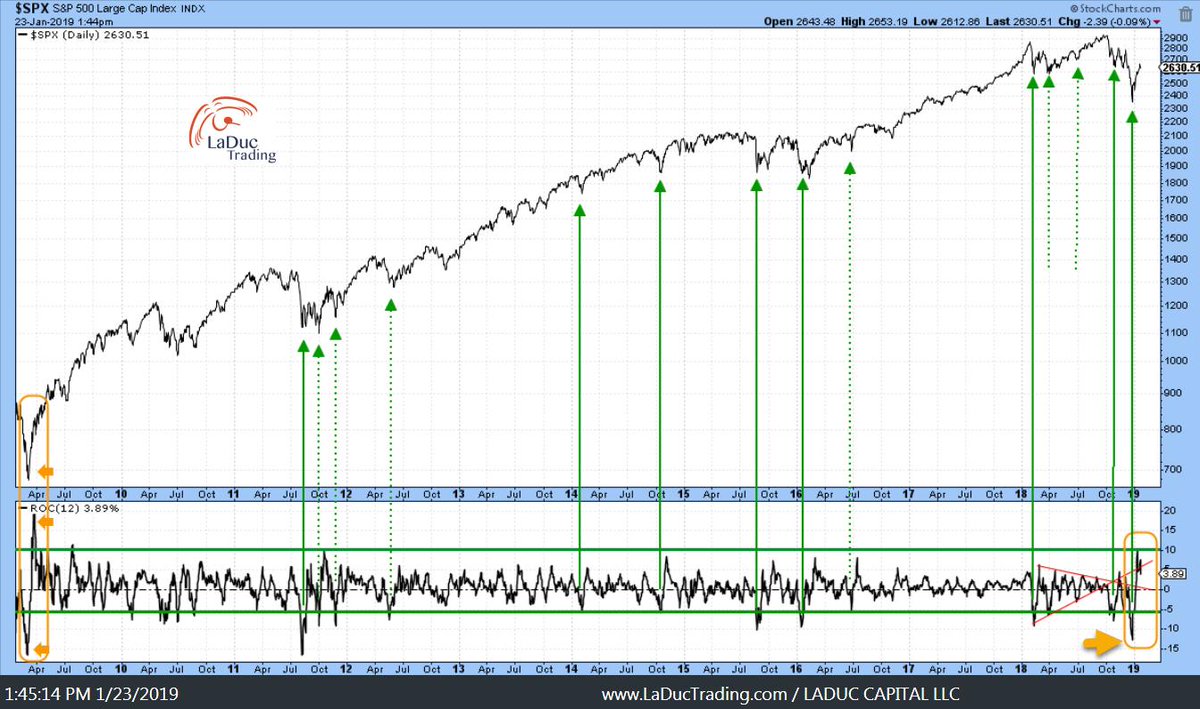
I presented clients with my strong breadth thesis (2016 + 2009 like), including this $SPX Rate of Change chart which affirms $NYSI. And both helped me time the Dec 'bottom'. Thank you both for sharing your insights/legacy! Here are 10 very-geeky charts: https://laductrading.com/2019/gone-fishing-newsletter-way-strong-still/ 

DzVbsO3XgAE0xKm.jpg
2 replies9 retweets15 likes
Reply
 2
 
Retweet
 9
 
 
Like
 15


#8 dTraderB

dTraderB

    Member

  • Traders-Talk User
  • 17,285 posts

Posted 14 February 2019 - 06:56 AM

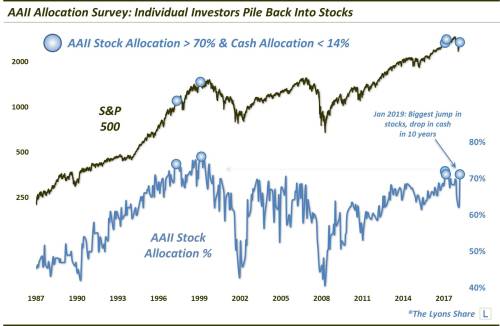
I still haven't seen the extreme bullishness that signals a top. Maybe another 2 to 3% SPX rally will do it, SPX 2800


Jesse Felder @jessefelder
FollowFollow @jessefelder
More

The combination of elevated stock allocation and low cash allocation has only been seen a handful of times — 3 months over the past year and approaching the tops in 1998 and 2000. http://jlfmi.tumblr.com/post/182772474300/investors-pile-back-into-stocks  by @JLyonsFundMgmt

DzS63haUwAA23eq.jpg
7:27 AM - 13 Feb 2019


#9 dTraderB

dTraderB

    Member

  • Traders-Talk User
  • 17,285 posts

Posted 14 February 2019 - 07:00 AM

ha ha 


Turned $5K into $50K by adding $45K to my brokerage account. More

Ramp Capital  ♿️added,

zerohedge @zerohedge
This was the first "last 30 minute" selloff of 2019
1:22 PM - 13 Feb 2019


#10 dTraderB

dTraderB

    Member

  • Traders-Talk User
  • 17,285 posts

Posted 14 February 2019 - 07:13 AM

From across the pond:


How to catch the best of a bull market while dodging the big bears


However, I stress it does not work all of the time. When markets are range bound, you will probably get whipsawed out. However, when they trend in a certain direction, the system keeps you on that trend, so that you end up enjoying 80-90% of the move.

You need to be looking at a weekly chart. As well as the price, you need to plot the 21-week exponential moving average (21EMA) and the six-week exponential moving average (6EMA). The 21EMA shows the average price of the previous 21 weeks, with greater weighting given to the more recent weeks – unlike the simple moving average which weights each week equally.

When the 6EMA crosses up through the 21EMA and the price is above, you have your buy signal. Both EMAs should be flat or sloping up. When the reverse happens – the 6EMA crosses down through the 21EMA, and the price is below, you have your sell signal.

Here’s how the system works

In order to make this clearer, let me illustrate this for you. Here is a weekly chart of the S&P 500 since 2012, with the buy and sell signals marked.

190214-MM02.png

You can see the buy signal in 2012, which kept you long until August 2015, when the sell signal came. The buy signal of November 2015 turned out to be a duff one and by December the market was on a sell signal. (The system would have lost money in 2015.)

There then followed another buy signal in April 2016 which kept you long until October 2018, when we go the next sell signal. It now looks like we are getting set up for another buy signal. (It wouldn’t surprise me to see this buy signal turn out a bit like 2015, as I rather suspect we are in a range-trading rather than runaway bull market, but that is just me second-guessing the system.)

I said the system works best in clearly trending markets. Here’s bitcoin since 2015, which has seen both runaway bull and bear markets.

190214-MM01.png

The buy signal came in October 2015 with bitcoin at $300, the sell signal came March 2018 with bitcoin around $8,500.

Timing your trades in the pound

The system can work across most markets, but it can work especially well in forex (as always especially when there is a strong trend). Here is “cable” (the pound vs the dollar).

190214-MM03.png

The buy signal preceded the chart, which starts in 2013. The sell signal came with sterling at around $1.60 in August 2014. We got a buy signal in June 2015, which didn’t work, as by September there was another sell. The trade rode the market all the way down until April 2017, when the next buy signal came in. The next sell signal came in May 2018. We almost got a buy signal earlier this month, but not quite.

I have an interest in small-cap natural-resource stocks, many of which are listed on the Venture exchange in Canada. It can be useful to know what the bigger state of play is, particularly in an industry as cyclical as mining and other natural resources.

Here we see the buy and sell signals of the Venture since 2010. Again – pile in when the market is on a buy signal, avoid when it isn’t. Natural resources have been awful this decade, as this chart shows.

190214-MM04.png

So there we go folks: a weekly trend-following system for you to use or not, as you see fit. Some people would charge you fortunes to learn systems like this, but not us.

https://moneyweek.co...g-the-big-bears