Here's the last 4 closes of $SPX
2792.34 Today
2793.90 Tuesday
2796.11 Monday
2792.67 Friday
Literally nowhere, we could've just went to the beach instead.
1:00 PM - 27 Feb 2019

Member

Posted 27 February 2019 - 04:26 PM
End of the month ramps (tomorrow), are as common as the Friday ramps now. After two nights of overnight weakness, I doubt asia sells ES down again tonight.
Member
Posted 27 February 2019 - 05:13 PM
Would not trade TESLA with this guy around at the top of the company.
Elon ‘Tusk’? Tesla CEO changes Twitter name, says there will be news on Thursday
Member
Posted 27 February 2019 - 05:16 PM
Thought we saw this already, since Dec 24th 2018.....
How Donald Trump and the Fed could ignite a ‘shock and awe’ market rally
“The ‘shock and awe’ upside scenario involves rescinding all U.S.-China tariffs instantly, causing certain tariff-sensitive firms to raise 2019 guidance, while the Fed commits to keeping reserves at ~$1.3T+. If all this were to come to pass, then the SPX will easily make a run towards 3K.”
https://www.marketwa...ally-2019-02-27
Member
Posted 27 February 2019 - 05:19 PM
TIM ORD
 VIX trades opposite to SPY and can give clues of what the SPY may do next. Back in October 2018, the SPY made a lower low and VIX matched its previous high and a bullish divergence for the SPY, suggesting a low. In November-early December, the SPY matched its previous low and VIX made a higher high, suggesting SPY might make a lower low (it did). The SPY is matching its December high and the VIX is making a lower low compared to its December low and a bullish divergence. This condition suggests the SPY may not retrace much of its advance and, once the retracement is done, the VIX suggests the SPY will exceed its December high ( the 2800 SPX range). The market could flip sideways. We will wait for a clearer setup.
 The top window is the 100-hour moving average of the TICK. When 100 TICK is above “0,” then generally the SPX is moving higher, while below “0” means the market may be moving lower. The 100-hourly TICK has turned down, but is still above “0," suggesting that the market is weakening but still in an uptrend. The bottom window is the 30-hour moving average, with the same rules applying. This shorter-term moving average has fallen below “0," a short term bearish sign. The next window up is the hourly cumulative TICK. The cumulative TICK rises and falls as the SPX rises and falls. Over the last couple of weeks, the cumulative TICK increased its angle of rising, showing strength, but over the last couple of days it has rolled over and is nearing its moving average. The SPX has reached its November-December high near the 2800 range and a resistance area. The different configurations of the TICK are starting to show weakness. Support is near the 200-day moving average, which is near the 2725 SPX range.
https://stockcharts....ry-26-2019.html
Member
Posted 27 February 2019 - 05:22 PM
Business Cycle Index Vs. Coincident Index Year over Year:
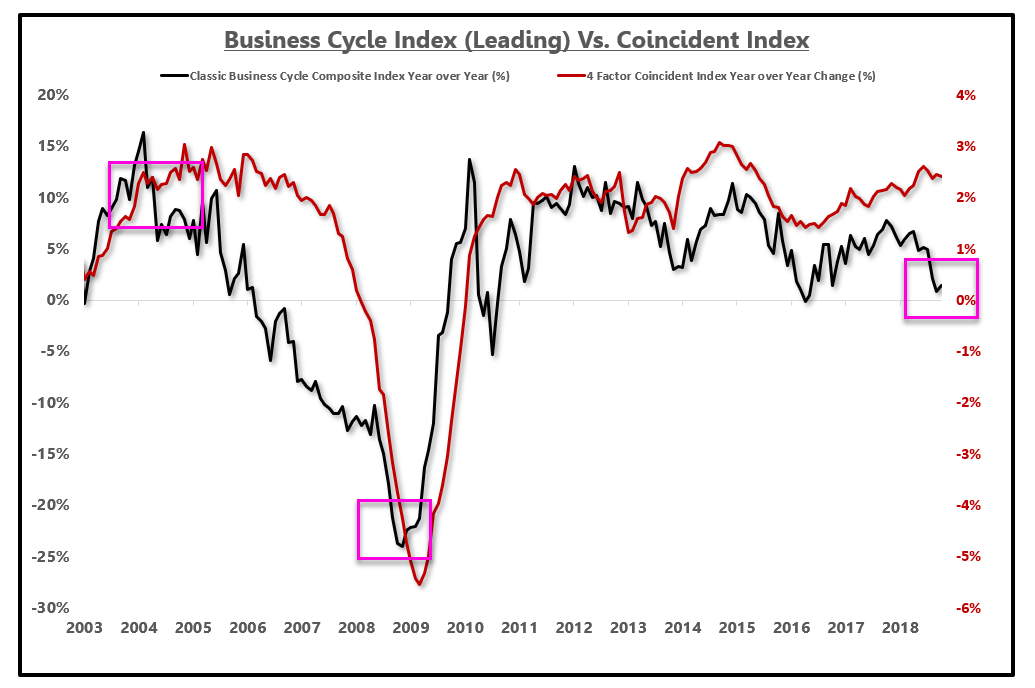
Source: EPB Macro Research
Today, while the level of recession risk remains rather muted, the business cycle index is moving lower, near the lowest level of this economic cycle.
Pent-up demand is slowing sharply, which raises red flags for the economic cycle.
The growth rate cycle is also trending lower.
We currently have a situation where the growth rate cycle is trending lower both domestically and globally, the business cycle is showing signs that pent-up demand is exhausted raising cyclical risk, but the coincident data is not recessionary yet.
This sequence of data implies that there will be a notable slowdown in the coincident data and that recession risk will be rising throughout 2019, but the conclusion of a hard or soft landing remains to be seen in the data.
https://seekingalpha...del-tells-close
Member
Posted 27 February 2019 - 05:25 PM
Feb. 26, 2019
The ES has a bullish trend momentum because the price closed Friday above the 9-day moving average price of 2,658.
With the market closing above 2,784 on Friday, we also came in with a weekly price momentum that was bullish.
The daily, weekly, and monthly trends have aligned themselves for a reversion to the mean target of 2,785; the second target for the monthly mean is 2,618.
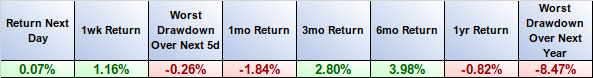
The daily S2 level was 2,813, which was met by the high of 2,814. We are now trading below the S1 level of 2,804, and it is activating a bearish signal. We are already on a daily short signal for S2. S1 is activating another short signal, confirming that the momentum is getting bearish. The weekly S1 level of 2,805 has triggered a short signal with a target of 2,785 on the weekly. The daily is at about 2,784. That is a pretty strong confirmation that 2,784 has a high probability that that target will be completed.
A close below 2,798 is going to kick-in a monthly bearish signal. If the market closes below 2,798 or 2,799, we will see what we call a triple harmonic bearish signal alignment, which means that all three trends have aligned themselves in price for a reversion to the mean to the first target of 2,785. The second target for the monthly mean is 2,618. The daily, weekly, and monthly prices are converging on these prices, making a powerful signal for traders with the highest probability of a reversion to the mean.
Member

Posted 28 February 2019 - 09:02 AM
Here's the last 4 closes of $SPX
2792.34 Today
2793.90 Tuesday
2796.11 Monday
2792.67 Friday
Literally nowhere, we could've just went to the beach instead.
1:00 PM - 27 Feb 2019
No kidding heh and not even a -1.5% intraday move, close but no way. I'm surprised they don't want to move it even a decent one to reset the market!
Member
Posted 28 February 2019 - 10:01 AM
NO, don't do this, please SPX!
We want movement, range, volatility
! OddStats
If $SPX somehow closes today (Thu) between 2792.38 and 2796.11, this will be the tightest range for 5 consecutive closes since Nov 14, 2014, which began a year of complete and total boredom: [data: stooq]
Member
Posted 28 February 2019 - 10:02 AM
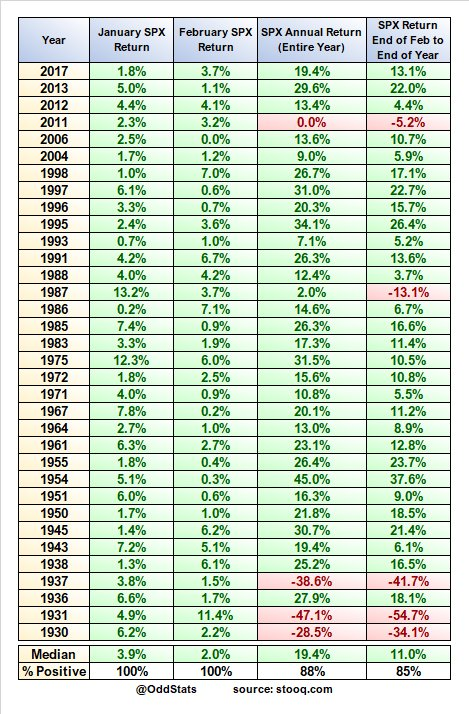
As long as $SPX doesn't drop -3.16% on Thursday, both January and February of 2019 will be positive. Just a reminder, that is *exceptionally* bullish for the rest of the year.
Edited by dTraderB, 28 February 2019 - 10:03 AM.


