S&P 500 Clears the 200-day. Should we Take the Bait?
We are all well aware of the S&P 500 and the 200-day moving average, but how well does this moving average work for broad market timing? Pretty well, it turns out, but only on the long side.
I put the 200-day moving average to the test for the S&P 500 and other indexes in "On Trend" on February 21st (Youtube link here). In a nutshell, I found that closes above/below the 200-day work well overall, but a second moving average is needed to smooth closing prices and reduce whipsaws. While there is no such thing as the perfect setting, I settled on the 20-day SMA and 200-day SMA combo. A 20-day SMA sits between the closing price and the 50-day SMA. Thus, it offers fewer whipsaws than the close/200-day cross and less lag than the 50/200 day cross.
The chart below shows the S&P 500 in the top window with the 20-day SMA (green) and 200-day SMA (red). A bullish signal triggers when the 20-day SMA crosses above the 200-day SMA (green vertical lines), while a bearish signal triggers when the 20-day SMA crosses below the 200-day SMA (red vertical lines). As the chart details, there were 34 crosses over the last 25 years.
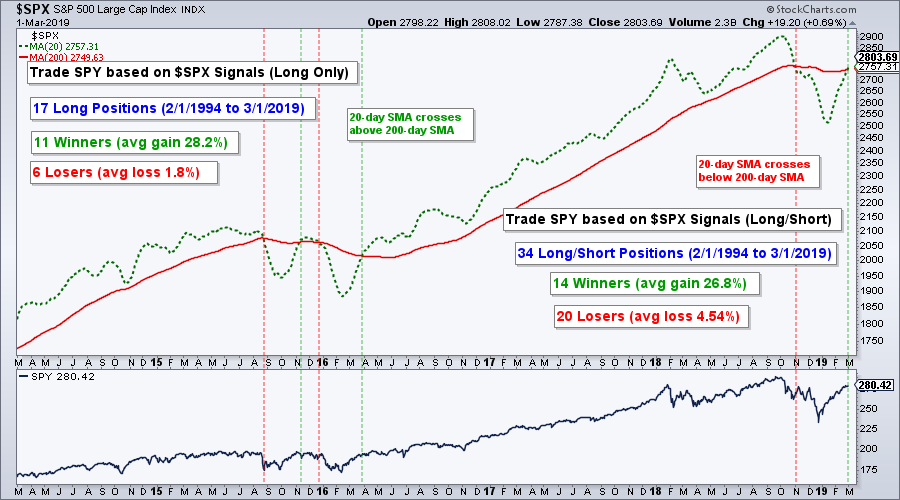
Chartists trading SPY based on these signals would have performed well on long signals, but not on short signals. Notice that there were 11 winners and 6 losers for when trading only long positions, and 14 winners and 20 losers when trading long and short positions. The vast majority of short positions resulted in losses.
The table below summarizes the results. Note that SPY includes dividends. I did not test with an inverse ETF because the data for the ProShares Short S&P 500 ETF (SH) only goes back to 2006. As the table shows, the Compound Annual Return is higher when trading only long positions and lower when short positions were added to the mix. The long-only strategy generated higher returns and was in the market just 72% of the time. Not only to did short positions reduce the returns, but they also increased the drawdowns.
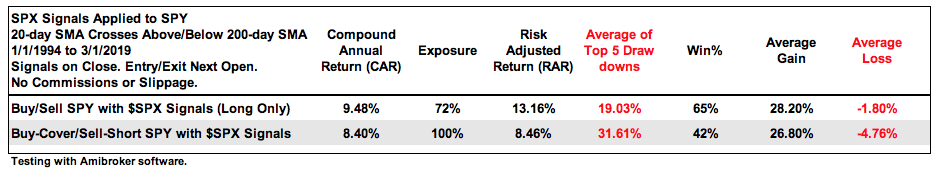
Market timing with the 200-day SMA can produce decent returns with reduced risk, but only on the long side. Despite some good short trades in 2001-2002 and 2007-2008, short trades as a whole did not make money over the last 25 years. The S&P 500 is above its 200-day SMA some 70 percent of the time and trends higher more often than lower. Why fight it!
https://stockcharts....e-the-bait.html