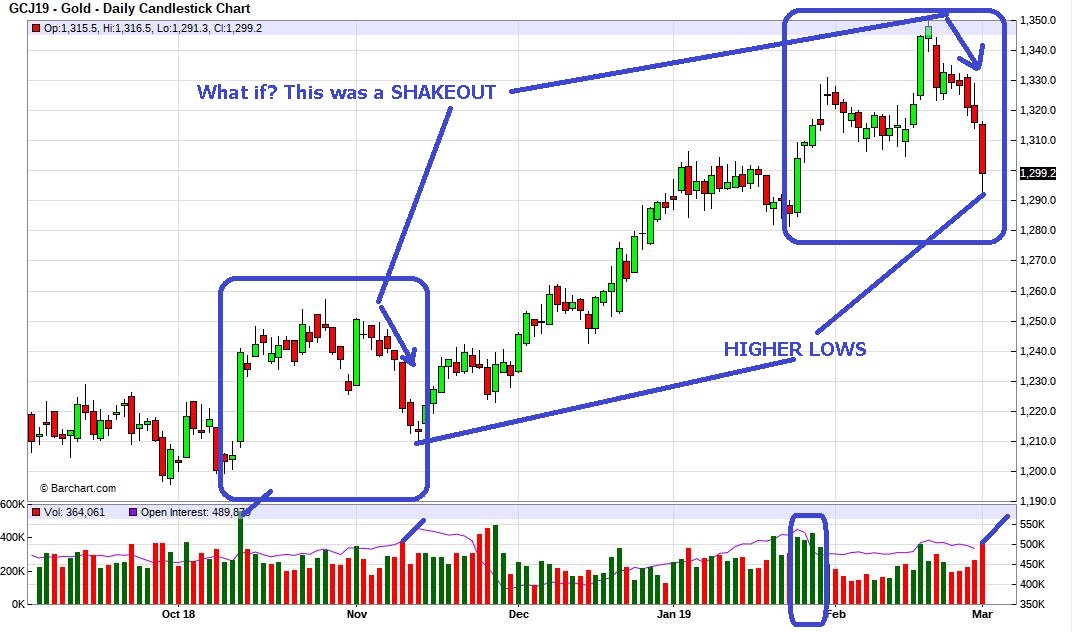
I don't need to tell you what was coming on 12/3 in the broad market... are we setting up for the NEXT LEG DOWN in Equity Market?

Volume Dynamics Specialist
Posted 02 March 2019 - 11:57 AM
I don't need to tell you what was coming on 12/3 in the broad market... are we setting up for the NEXT LEG DOWN in Equity Market?
Member

Posted 02 March 2019 - 05:20 PM
Possibly..... but I see bonds collapsing soon, turning into no bid market, and so if we see that and see a very fast or accelerating bump up in interest rates what happens to stocks and gold in that scenario ? both down hard ?
Member

Posted 04 March 2019 - 12:41 PM
Possibly..... but I see bonds collapsing soon, turning into no bid market, and so if we see that and see a very fast or accelerating bump up in interest rates what happens to stocks and gold in that scenario ? both down hard ?
Why do u see a collapse in bonds, 'no bid market' ? TIA
Member
Posted 04 March 2019 - 08:34 PM
Member

Posted 04 March 2019 - 08:45 PM
I don't need to tell you what was coming on 12/3 in the broad market... are we setting up for the NEXT LEG DOWN in Equity Market?
My work suggests an IT top was just made...

Member

Posted 04 March 2019 - 11:31 PM
I've learned one thing for sure on this site: to always ask what kind of waves are being labelled. This doesn't look like Elliott.
Member
Posted 05 March 2019 - 02:37 PM
This is the chart I created the week previous, but if you don't "see it" it won't help...
Member
Posted 05 March 2019 - 02:53 PM
But is it Elliott? Thanks.
Member
Posted 05 March 2019 - 03:54 PM
But is it Elliott? Thanks.
I'm sorry... I can't help you there. If you don't understand EW theory, you should brush up on it. The basic premise is that impulsive waves move in five waves (5-3-5-3-5) and corrective waves move in three waves (3-3-5 or 5-3-5) - ALL ending c-waves are five waves. There are a few exceptions, such as double zig-zags (3-3-3-3-3). My charts say the c-wave of wave-B is five waves.
Below is what I think the SPX is developing into a double zig-zag wave-(iv):
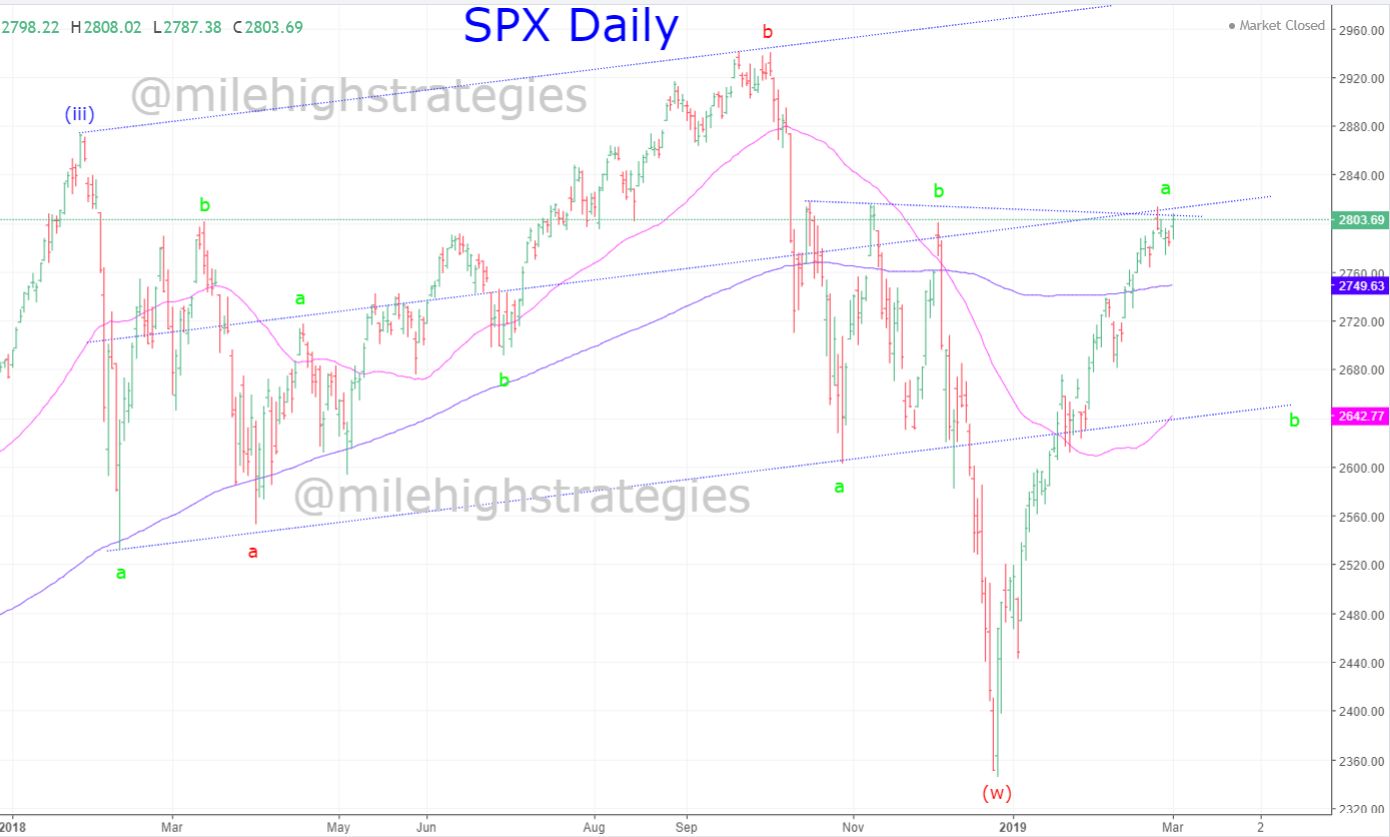
Edited by tsharp, 05 March 2019 - 03:57 PM.
Member
Posted 05 March 2019 - 04:59 PM
The reason I asked is I thought I was looking at Elliott on another thread and it was actually a Welles Wilder (sp?) pattern. I consider myself a relatively amateur Elliottician but I'm not familiar with the pattern of your red B wave where it goes below the red A wave. From my limited knowledge, that's prohibited and not covered by standard Elliott as a zig-zag or flat or whatever since the B is not correcting the A as it ends below it. Thanks for your patience.
Edited by hhh, 05 March 2019 - 05:03 PM.


