Jump to content


Photo

TRAPPED! SPX unable to break out .....up or down!


  • Please log in to reply
20 replies to this topic

#1 dTraderB

dTraderB

    Member

  • Traders-Talk User
  • 17,256 posts

Posted 05 March 2019 - 09:41 PM

SPX closed again in that magical zone, almost falt, and is trapped in that zone defined by the high & low of yesterday's LONG candle.

But it is still comfortably above the 200ma (magenta), the 50ma (yellow) and the 20ma 9blue).

White line is the VIX, still rolling along the bottom...


So, until it breaks out above or below, it is trapped in that zone, who knows for how long? 


Note how the 20ma is rising nicely... and expect the same from the yellow 50ma.


Why? Simple math: it is almost 50 days since the bottom on Dec 24th so from tomorrow the 50ma will be excluding that huge drop in December and including only closes in that V-shape rally! 


NO BIG DEAL, right?

....except that yellow 50ma that is now below the almost flat 200ma (magenta) can quickly rise to cross over the 200ma !!!


So, unless the market drops rapidly the 50ma cross can happen sooner than you think.


53648533_10156670334365783_5467418772816


#2 dTraderB

dTraderB

    Member

  • Traders-Talk User
  • 17,256 posts

Posted 05 March 2019 - 09:43 PM

Beware of Trannies That Lag
Posted on March 5, 2019by macromon

Summary

  • We construct a relative performance index (TRP) of the Dow Transports and Dow Industrials Index 
  • In all three large and major 2018 sell-offs, the TRP signaled an impending correction 7-18 trading days before markets rolled over
  • The TRP peaked on Valentine’s Day and is down 3.60 percent yet the Dow Industrials is still up 1.53 percent has yet to roll over. 
  • The Dow did hit a high on February 22 and is down just around 1 percent 
  • We don’t know if the TRP is confirming an impending sell-off but investors and traders should closely monitor the relative performance of the Transports 

The Dow theory on stock price movement is a form of technical analysis that includes some aspects of sector rotation. The theory was derived from 255 Wall Street Journal editorials written by Charles H. Dow (1851–1902), journalist, founder and first editor of The Wall Street Journal and co-founder of Dow Jones and Company. Following Dow’s death, William Peter HamiltonRobert Rhea and E. George Schaefer organized and collectively represented Dow theory, based on Dow’s editorials. Dow himself never used the term Dow theory nor presented it as a trading system.  – Wikipedia

We constantly monitor the Dow Transports Index and its relative performance as a signal of future equity price action.  There is a growing concern that the Trannies have been underperforming other indices, including its father, the Dow Jones Industrials, since Valentine’s Day.

https://global-macro...nnies-that-lag/


#3 dTraderB

dTraderB

    Member

  • Traders-Talk User
  • 17,256 posts

Posted 05 March 2019 - 09:45 PM

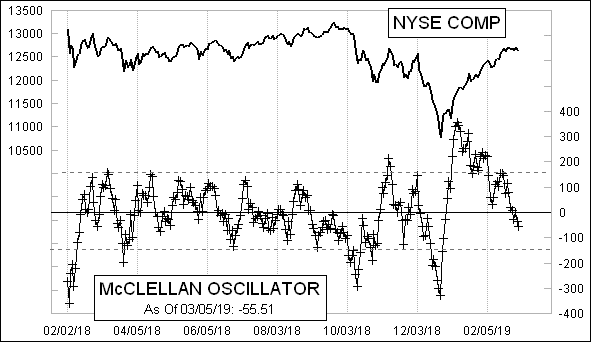
McOsc down, A/D slight down...


https://www.marketin...llan-oscillator


BELOW ZERO


McClellanOsc_491.gif


#4 dTraderB

dTraderB

    Member

  • Traders-Talk User
  • 17,256 posts

Posted 05 March 2019 - 09:47 PM

TRANSPORTS attracting attention:


  1. And here we go. CNBC discovers the Transports.

    8 replies1 retweet33 likes
    Reply
     8
     
    Retweet
     1
     
     
    Like
     33
  2.  

    Utes green 10 of the last 12. Today was first red in 6 days. Uh oh, @carlquintanilla what did you do?!

    2 replies1 retweet11 likes
    Reply
     2
     
    Retweet
     1
     
     
    Like
     11
  3.  

    SPX been red 5 of the last 6 days

    9 replies6 retweets23 likes
    Reply
     9
     
    Retweet
     6
     
     
    Like
     23
  4.  

    Worst day for the Transports of the 8 red days.


#5 dTraderB

dTraderB

    Member

  • Traders-Talk User
  • 17,256 posts

Posted 05 March 2019 - 09:49 PM

Bespoke @bespokeinvest
FollowFollow @bespokeinvest
More

New Orders component of February's ISM Services report hit its highest level since August 2005 and had its 3rd largest increase on record. What slowdown? https://www.bespokepremium.com/think-big-blog/no-slowdown-in-services-sector/ 

D06sHlFX0AUN3SS.png
11:04 AM - 5 Mar 2019


#6 dTraderB

dTraderB

    Member

  • Traders-Talk User
  • 17,256 posts

Posted 05 March 2019 - 09:50 PM

Holger Zschaepitz @Schuldensuehner
FollowFollow @Schuldensuehner
More

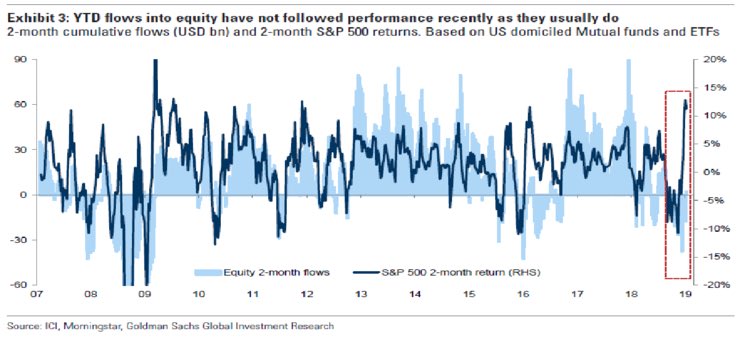
With so few investors buying America’s $5 trillion post-Christmas stock rally, Wall Street is starting to wonder whether apathy could kill the melt-up. Wall Street strategists question sustainability of 2019 gains. https://www.bloomberg.com/news/articles/2019-03-05/goldman-sees-crisis-echo-in-big-stock-rally-bereft-of-buyers 

D07Zqv_XQAAIEIY.jpg
2:22 PM - 5 Mar 2019


#7 dTraderB

dTraderB

    Member

  • Traders-Talk User
  • 17,256 posts

Posted 05 March 2019 - 09:55 PM

Screen-Shot-2019-03-05-at-6.32.52-PM.png 

Volatility is making a comeback. Monday’s wild swing produced the S&P 500’s biggest loss in nearly a month and the intraday price range was one of the widest of the year. Tuesday’s dip also marked the fifth loss out of the last six trading sessions.

Just going off of that description, you’d expect stocks to be down a lot. Fortunately, they only slipped half a percent from last week’s closing high. That said, this back and forth is definitely getting people’s attention. But none of this should come as a surprise. Last week I wrote:

“Widely watched resistance levels often turn into self-fulfilling prophecies. Prices rally up to resistance. Technical traders see this signal as a good place to take profits. Their profit-taking pressures prices, leading to a small pullback. Other traders see the weakness develop, so they start selling too, adding even more pressure. Prices keep slipping until either we run out of sellers, or they are attractive enough that dip buyers jump in and take advantage of the discounts.

Given how far the market’s come since the Christmas lows, it wouldn’t be a surprise to see the market take a break and catch its breath. In fact, that would be the normal and healthy thing to do. I would be far more concerned about the sustainability of this rebound if we keep racing ahead without resting.”

Sign up for FREE Email Alerts to get profitable insights like these delivered to your inbox.

Prices only slipped a fraction so far and it is encouraging to see supply dry up and dip buyers jump in so quickly. But this string of losses is definitely a new thing for a market that has done nothing but go up all year.

Everyone knows prices cannot rally at this rate forever. But they lose track of this fact in the moment. People love trends and they cannot help but imagine they continue as far as the eye can see. But just like every dip eventually bounces, every rally eventually stalls.

One of the bigger flags for me was Monday’s fizzled breakout following encouraging news coming out of US/Chinese trade negotiations. If you believe the headlines, the sides are quickly approaching a deal. Weeks ago, this news would have sent stocks flying 2% or 3%. Unfortunately, Monday morning they only managed to eke out a 0.4% opening gain before fizzling and shedding nearly 50-points. We were lucky a late-day rebound recovered a big chunk of those intraday losses, but that midday swoon demonstrates just how much selling potential is hiding in this market.

The biggest question is if Monday was nothing more than a momentary bout of indigestion. Or if it really is the first signs of a mood change. I certainly wish we could go up like this forever because that would make trading a million times easier, but we know that’s not the case. This rally will pause and even pullback, the only question is when.

While we can continue drifting higher over the near-term, the rebound from the Christmas lows consumed a ton of demand. The problem is that no matter how much better the news gets, eventually we stop going up because everyone who wanted to buy has already bought. This happens so frequently in the market it actually has its own cliche “buy the rumor, sell the news”.

The market is still acting well and the drift higher can continue over the near-term, but a lot of buying has already happened and there is a lot of air underneath us. Limited upside and lots of downside creates an almost tragic risk/reward. Long-term investors should ignore these near-term gyrations, but for a short-term trade, buying up here definitely borders on foolish.

The way I view this market from my years of experience, it is too late to buy, but too early to short. Prices are holding up well and it will take more than just weak price-action to convince confident owners to abandon their stocks. Most likely, the fatal blow with come from the trade deal. Failing to reach a deal will obviously send stocks tumbling. But even a deal could ultimately turn into a letdown if it isn’t as good as the market is hoping for. We very well could be on the verge of a “buy the rumor, sell the news” kind of trade.


https://cracked.mark...-mood-changing/


#8 dTraderB

dTraderB

    Member

  • Traders-Talk User
  • 17,256 posts

Posted 05 March 2019 - 09:59 PM

Technically Speaking: Monthly Chart Review Yields Bearish Signals

Written by Lance Roberts | Mar, 5, 2019


https://realinvestme...bearish-signals


#9 dTraderB

dTraderB

    Member

  • Traders-Talk User
  • 17,256 posts

Posted 05 March 2019 - 10:00 PM

RAJ says a high has been put in place...


SReview from 2/26/19 Report: "The 2/21 time Square CIT High could be the overdue 45 TD Hurst swing 2/25H, along with the 2/22 time Geo and 2/23 (2/22-25) Solar Time CITs."
 
"There is a CD to TD CIT is on 2/28, along with 25 TD cycle due 3/1, the 3/1 Bradley and 3/4 Emini Apex CIT is biased to be another High."
 
Review from 2/27/19 Update: "We are seeing a further decline this morning, confirming the 2/25H is in place, but after a 2/27L, we are still expecting another High due 3/1-4 lower or higher High."
 
Actual: We made a 2/25H, declined into 2/27L and made a 3/4H
 
 
What's Next: There is a proprietary Master Cycle (MC) that forecasted:
 
1. 9/21/18H
2. 10/29/18L
3. 11/7/18H
4. 12/3/18H
5. 12/26/18 major Low. 
 
The MC can be off by 1-2 TD, but it has been generally in there.  
 
The MC now suggests a 3/04-05 major swing Highfollowed by a sharp decline into XXX. 


Join our free forecasts and Updates at: 


#10 dTraderB

dTraderB

    Member

  • Traders-Talk User
  • 17,256 posts

Posted 05 March 2019 - 10:01 PM

Sentiment Speaks: Beware The Ides Of March
Summary

The middle of March is looking rather ominous.

Support in the market is now 2750.

2500-2640 is next lower support.

https://seekingalpha...ware-ides-march