2YR TREASURIES: remains one of my largest long positions after going Bearish on shorter-term yields in OCT

3:25 AM - 15 Mar 2019

Member
Posted 15 March 2019 - 06:32 AM
2YR TREASURIES: remains one of my largest long positions after going Bearish on shorter-term yields in OCT
Member
Posted 15 March 2019 - 06:33 AM
My latest Chart In Focus article, "Price = Sentiment", is posted at https://www.mcoscillator.com/learning_center/weekly_chart/price_equals_sentiment/ …

Member
Posted 15 March 2019 - 06:36 AM
DJIA's 50 and 200 dma's are now 7 points apart. Where are the Golden Cross folks?

Member
Posted 15 March 2019 - 06:49 AM
Just seems as if the SKY IS ALWAYS FALLING in the zerohedge world, but, of course, it's not in the real world:
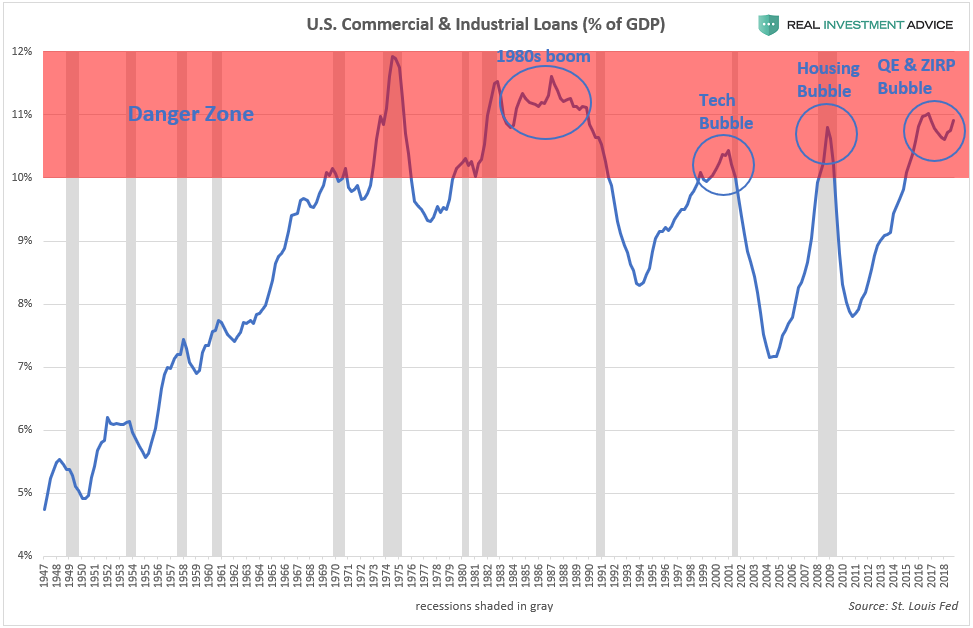
C&I Loans Enter The Danger Zone
One way of determining when the C&I loan cycle (and, therefore, the overall economic cycle) is nearing its end is by charting total outstanding commercial and industrial loans as a percentage of GDP. When C&I loans are at 10% of GDP or higher (the “Danger Zone”), that is typically a sign that the cycle is long in the tooth and about to tip over into a recession. According to the chart below, recessions occurred shortly after C&I loans peaked within the “Danger Zone.” C&I loans are currently in that zone, which I see as further confirmation that we are in a Fed-driven economic bubble that will end badly.
Member
Posted 15 March 2019 - 07:03 AM
https://www.marketwa...-03-15?mod=bnbh
Member
Posted 15 March 2019 - 07:08 AM
Member

Posted 15 March 2019 - 09:23 AM
Smashing the VIX...... My VST trading signals are long, but I'm just watching the show....
It sure takes a lot of $VIX crushing and open gaps to eek out very few incremental gains on $SPX. #justsaying
https://twitter.com/NorthmanTrader
" “There is only one side to the stock market; and it is not the bull side or the bear side, but the right side” Jesse L. Livermore
Member
Posted 15 March 2019 - 10:05 AM
bought another 1/4 position of VXXB 28.59
Member
Posted 15 March 2019 - 10:06 AM
and gathering 5 and 6 point profit on NQ long & short trades
But, you got to take what the market gives, and soon there could be a nice 40 to 50 point NQ trade - short or long
Member
Posted 15 March 2019 - 10:07 AM
only watching ES NQ, QQQ options, VXXB and VIX screens today


