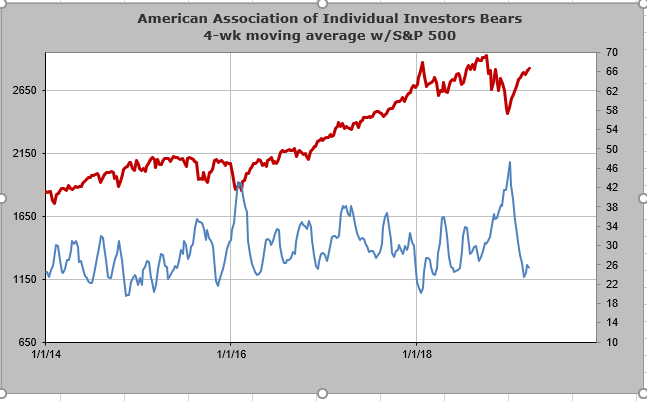
They killed all the bears?
AAII Bears fell off a cliff last week. Lemme think what happened? Oh yes, the market rallied. See my pinned tweet. 4 wk ma of AAII Bears here.
4:05 AM - 21 Mar 2019

Member
Posted 21 March 2019 - 07:43 AM
They killed all the bears?
AAII Bears fell off a cliff last week. Lemme think what happened? Oh yes, the market rallied. See my pinned tweet. 4 wk ma of AAII Bears here.
Member
Member
Posted 21 March 2019 - 08:09 AM
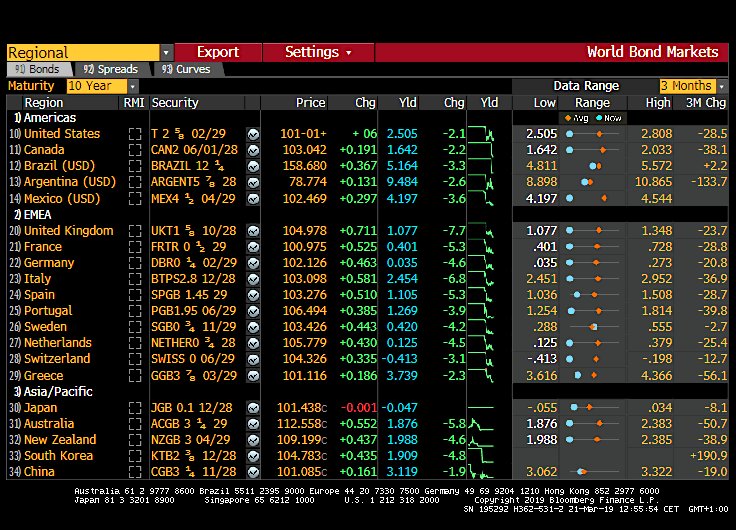
Global bond yields in free fall after Fed waved the white flag on policy normalization. 10y Bund yields at 0.03%, US 10y yields at 2.5%, 10y Japanese yields at -0.05%
Member

Posted 21 March 2019 - 08:22 AM
The US-China trade talks that has been a big hope for the market may turn sour. A correction is due now...................
Edited by redfoliage2, 21 March 2019 - 08:22 AM.
Member
Posted 21 March 2019 - 08:23 AM
Mar. 21, 2019 1:17 AM ET
Extremely rare combination setup for the stock market.
Monitoring the status of the S&P 500's breakout.
A pause from hybrid/defensive assets.
Monday’s session saw the first close above the S&P 500’s upper Bollinger Band (purple arrow) since the current rally began in late December 2018. In early February, the market approached the upper band and then took a very brief pause (blue arrow). Tuesday’s session featured an intraday reversal that started from above the upper band (red arrow). As of this writing, the bigger picture remains constructive.
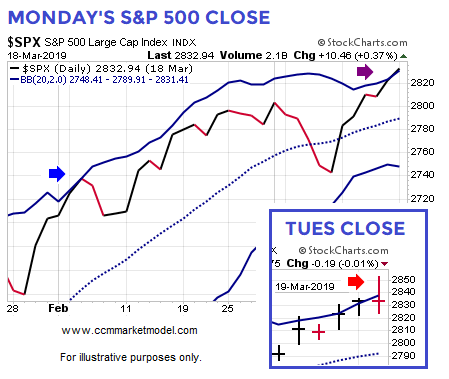
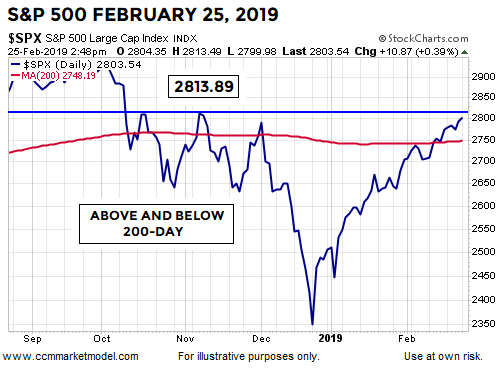
Three weeks ago the S&P 500 (SPY) had just cleared the 200-day moving average (shown in red below) and was approaching the highs made in Q4 2018 (blue horizontal line). The chart below first appeared in a February 25 post titled “Markets Hovering Near Important Guideposts”.
 The same chart during Tuesday’s session (below) shows the S&P 500 is currently trying to hold above three relevant areas. The market appears to have successfully retested the 200-day earlier this month (A). The orange box (
 , thus far, has done little to slow the market’s strong advance off the 2018 low. Last Friday, the market closed above the blue line © for the first time and nailed down the 3rd consecutive close above the Q4 highs during Tuesday’s session. The blue line sits at 2813; Tuesday’s close was 2832. Wednesday's intraday low was 2812 and change.
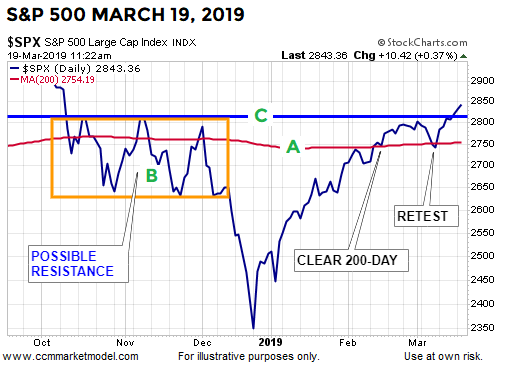 In the chart above, the longer the S&P 500 (VOO) can hold above A, B, and C, the easier it is to remain optimistic. It should be noted, even under longer-term bullish conditions, the S&P 500 may come back and retest the horizontal blue line which sits at 2813. A retest could take place in a matter of days or could come weeks/months later. Wednesday’s Fed statement and press conference could usher in some relevant information impacting the breakout one way or another.
This week's stock market video looks at an extremely rare combination setup for the S&P 500 that was last seen in 1991.
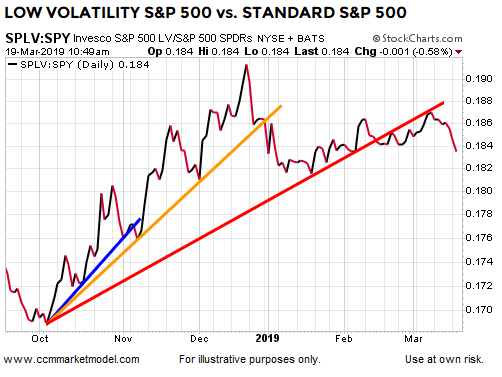
A Pause For Hybrid/Defensive AssetsWhile the S&P 500 Low-Volatility ETF (SPLV) has performed well and is still hovering near new highs, the conviction to own more-conservative S&P 500 stocks has been waning. If the S&P 500’s breakout above 2813 holds (TBD), the relative demand for SPLV could decrease further.
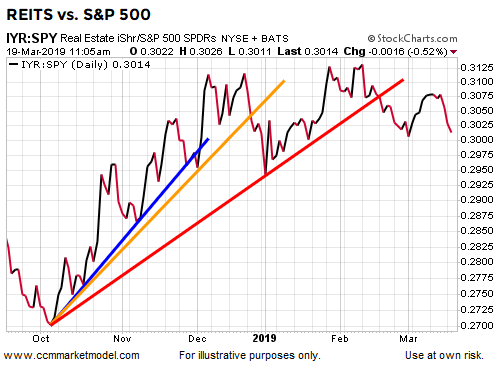
 The same concepts apply to real estate investment trusts (NYSEARCA:IYR). Viewed in isolation, IYR is still hovering near new highs, but signs of relative weakness are evident on the chart below.
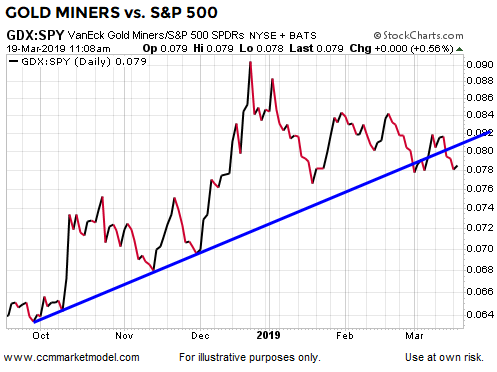
Viewed in isolation, gold-mining stocks (GDX) remain in an uptrend relative to the low that was made in 2018. However, the relative trend has not made a new high since late December.
 The “lower conviction to own defensive assets” theme carries over to the bonds (TLT) vs. stocks (SPY) chart shown below.
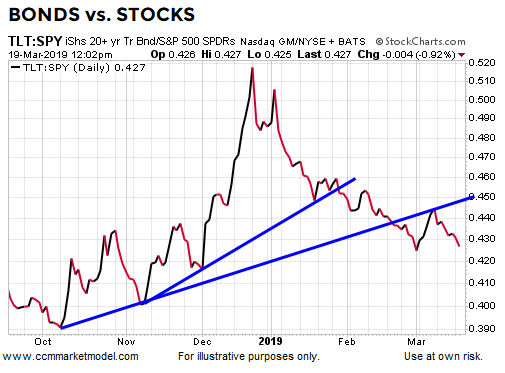
The Fed's dovish interest rate forecast delivered Wednesday could provide bonds, income, and weak-dollar assets with a tailwind, telling us to remain open to a shift on the SPLV:SPY, IYR:SPY, GDX:SPY, and TLT:SPY charts. The stock market’s recent short-term extended condition and the reaction to Wednesday’s Fed meeting allow for a pause to see how things play out near 2813 on the S&P 500.
https://seekingalpha...e-last-70-years
Member
Posted 21 March 2019 - 08:25 AM
The US-China trade talks that has been a big hope for the market may turn sour. A correction is due now...................
Looks like Trump is using a bit of buster & hard talk to try to get concessions; the Chinese are also playing their game in tandem with N Korea.
I still think there will be a deal, or something that can be sold as a deal, but it will calm the markets and can produce a 5% rally
Member
Posted 21 March 2019 - 09:27 AM
a 100-point plus NQ move up!
am happy to catch average of 62 points per lot in my 8-lot trade!
Getting ready to short or long NQ, again.
Member
Posted 21 March 2019 - 11:23 AM
Wish I had time to trade the Brit Pound.
It's tanking.
But, I am daytrading NQ & VXXB so it is impossible
NQ has stalled during past 25 minutes, ES retracing from high.
Looking for a VXXB long near 28.20/10
Member
Posted 21 March 2019 - 12:51 PM
Loitering near the high, looking for more energy to make new daily highs.... be very careful with LONGS at these levels at this time of the trading day.
Some people are very concerned, (for lack of a better word), including the Bond King!
Sven Henrich Retweeted Jeffrey Gundlach
In central banking you don’t need a straight face. Just a dovish expression will do.
Sven Henrich added,
Member
Posted 21 March 2019 - 12:54 PM
Quick look at the VIX hourly -- down 3% today but still above the 2019 low of 12.37