Jump to content


Photo

SPX 4000? Why not, the charts project it!


  • Please log in to reply
34 replies to this topic

#1 dTraderB

dTraderB

    Member

  • Traders-Talk User
  • 17,161 posts

Posted 21 March 2019 - 08:20 PM

Seriously, with today's breakout, SPX could easily surpass the historic high in a weeks and proceed to  Summer to remember, all the way to 4000!


Well, no, people also thought NASDAQ would have reached 10K in 2K (2000) but it all collapsed like the proverbial house of cards because you can levitate nothingness and fluff for only so long. 


With the VIX stubbornly staying above 13, VXXB down slightly, and many anxious to get into the action that they had missed in 2019, I expect a market that will soon fizzle out.


How soon is SOON?  not more than 2 weeks. 

How high will it go? Possible new highs but only marginally so. 


But, one has to trade WITH the markets, at least on a ST basis, so ride it upwards until it reverses.


This from WSJ:


By Alex Eule |  Thursday, March 21

Tech to the Rescue. So much for the Federal Reserve's anxiety over the economy. A day after interest-rate policy makers unnerved investors with a surprise dovish turn, the market chose to see the silver lining instead. With no rate hikes on the horizon, high-growth tech stocks look particularly appealing again. The Nasdaq Composite jumped 1.4%, powered by new excitement over Apple, as well as Micron Technology's better-than-expected earnings report. 

Investors are eagerly awaiting Apple's TV streaming announcement scheduled for Monday. One analyst upgraded the stock today in anticipation of the event. 

"On Monday, Apple will announce a new content service that, IF adopted by its users should lower churn and drive higher lifetime value for each of Apple's 900 million unique ecosystem users," Needham analyst Laura Martin wrote in her upgrade to Strong Buy. Apple shares closed up 3.7% today. 

Time will tell if Apple's latest strategy justifies the excitement, but there's reason to think that investors are getting ahead of themselves. Tech site Recode reported today that Apple's offering won't be the Netflix clone some are expecting. 

The tech sentiment outweighed the big news in health care. Biogenplunged 29% after the pharmaceutical company said it was ending trials of its much-heralded Alzheimer's drug. Biogen said the latest trials of the drug had failed. It's the latest in a string of industry disappointments around Alzheimer's treatment.  

“This disappointing news confirms the complexity of treating Alzheimer’s disease and the need to further advance knowledge in neuroscience," the company's CEO said in a statement.


DJIA: +0.84% to 25,962.51
S&P 500: +1.09% to 2,854.88
Nasdaq: +1.42% to 7,838.96

The Hot Stock: Conagra Brands +12.8%
The Biggest Loser: Biogen -29.2%

Best Sector: Technology +2.5%
Worst Sector: Financials -0.3%


#2 dTraderB

dTraderB

    Member

  • Traders-Talk User
  • 17,161 posts

Posted 21 March 2019 - 08:21 PM

@OddStats
FollowFollow @OddStats
More

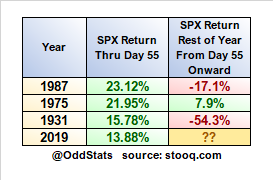
Oh. I see. Thru 55 trading days, 2019 is now the 4th best start to any year ever on $SPX. The 3 years that started better than us and how they did the rest of the year:

D2NWrm1UwAAyj6o.png
1:19 PM - 21 Mar 2019


#3 dTraderB

dTraderB

    Member

  • Traders-Talk User
  • 17,161 posts

Posted 21 March 2019 - 08:23 PM

NQ on fire but RUT lagging


https://www.marketin...llan-oscillator


#4 dTraderB

dTraderB

    Member

  • Traders-Talk User
  • 17,161 posts

Posted 21 March 2019 - 08:31 PM

No, not seeing a recession in 2019, but the FED has far better data. 


“If earnings are weak again, I don’t think stocks are going to look through that this time.” Michael Wilson

Morgan Stanley’s chief equity strategist Michael Wilson says the Federal Reserve’s Wednesday decision underlined the central bank’s uber-dovish stance, which means corporate earnings are going to be paramount for stock-market investors.

Read: Bulls looking for repeat of 2016 stock-market rally will be disappointed: Morgan Stanley

Speaking to CNBC on Thursday morning, the strategist said the Fed statement was “kind of the full capitulation” by the Federal Open Market Committee, after it left rates unchanged, as expected, but also cut its projection for future rate increases this year to zero from two back in December and downgrading its 2019 economic outlook for gross domestic product to 2.1% from 2.3%.

https://www.marketwa...h-it-2019-03-21

With Fed’s cards on the table, ‘not a bad time’ to take profits, advises Guggenheim’s Minerd

https://www.marketwa...nerd-2019-03-21


#5 dTraderB

dTraderB

    Member

  • Traders-Talk User
  • 17,161 posts

Posted 21 March 2019 - 08:37 PM

Everyone watching YIELD CURVE,  possible inversion.


A key recession indicator is flashing as US yield curve hits flattest ...
The Globe and Mail-6 hours ago
The three-month and 10-year spread is the Fed's preferred measure of the Treasury yield curve as it shows the strongest historical correlation between curve ...
Bond Yields, Bank Stocks Sink as Cautious Fed Worries Investors
Wall Street Journal-6 hours ago
A flatter yield curve hurts bank stocks because it narrows the gap between what lenders pay on deposits and charge on loans, a spread known as the net ...
Bond Traders Turn Eyes to What May Happen After Curve Inversion
Bloomberg-6 hours ago
The surprising move by Federal Reserve officials to slash the prospects of an interest-rate hike this year has one of the Treasury market's favorite indicators ...
Opinion: The Fed's total capitulation is a bad omen for the stock market
MarketWatch-8 hours ago
Following the Fed decision, markets are increasingly pricing in rate cuts in 2020. ... And what does the 30-year vs. five-year yield curve suggest here in context of ...


#6 dTraderB

dTraderB

    Member

  • Traders-Talk User
  • 17,161 posts

Posted 21 March 2019 - 08:37 PM

That dang YIELD CURVE, again!


Yield Curve Cycles- The yield curve also takes on a similar path that tends to mirror economic cycles. When the economic cycle portends strong growth, the yield curve steepens. That is to say, the difference between longer and shorter maturity yields rises. This occurs as investors in longer maturity bonds become increasingly concerned with the potential for rising inflation resulting from stronger economic growth.

When strong growth spurs inflation expectations or actual inflation rises, the Fed begins to take action. To combat rising price expectations,they tighten policy with a higher Fed Funds rate. Shorter-term bond yields follow the Fed Funds rate closely, and as the Fed tries to dampen growth, the yield curve flattens. In that instance, longer-term investors are comforted by the Fed actions. This causes longer maturity yields to rise by less than those of shorter maturity yields, or it can help push longer maturity yields lower on an outright basis. 

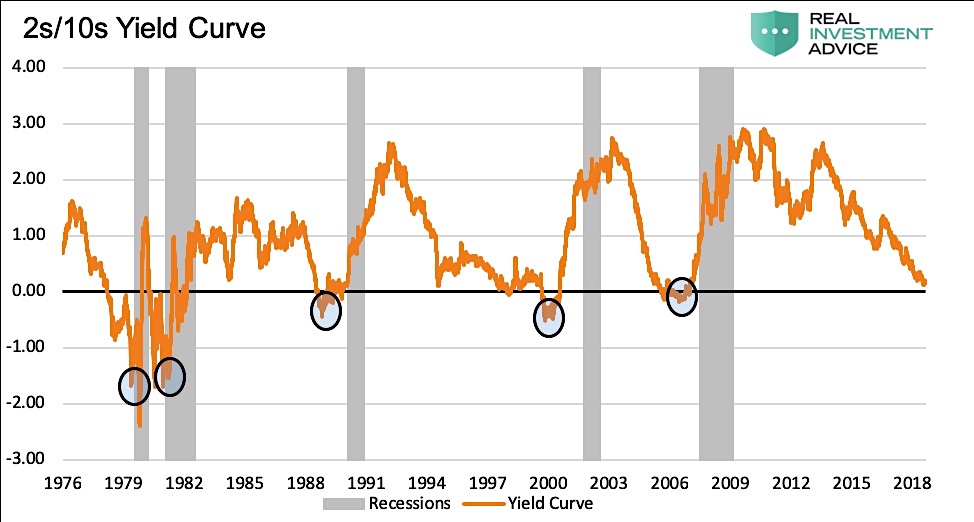
A steeper yield curve increases the incentive to lend and generates more economic growth while a flatter curve reduces the incentive and slows economic growth. The graph below shows how an inverted yield curve, where the yield on a  2-year U.S Treasury note is higher than that of a 10-year U.S. Treasury note, has paved the way for every recession since at least 1980.

2-10-yield-curve-inversion-history-chart

Data Courtesy: St. Louis Federal Reserve (FRED)


#7 dTraderB

dTraderB

    Member

  • Traders-Talk User
  • 17,161 posts

Posted 21 March 2019 - 08:47 PM

Tom is also talking BONDS:


The Bond Market Is Sending Us The Most Bearish Signal
Tom Bowley |  March 21, 2019 at 09:00 AM
Current Outlook

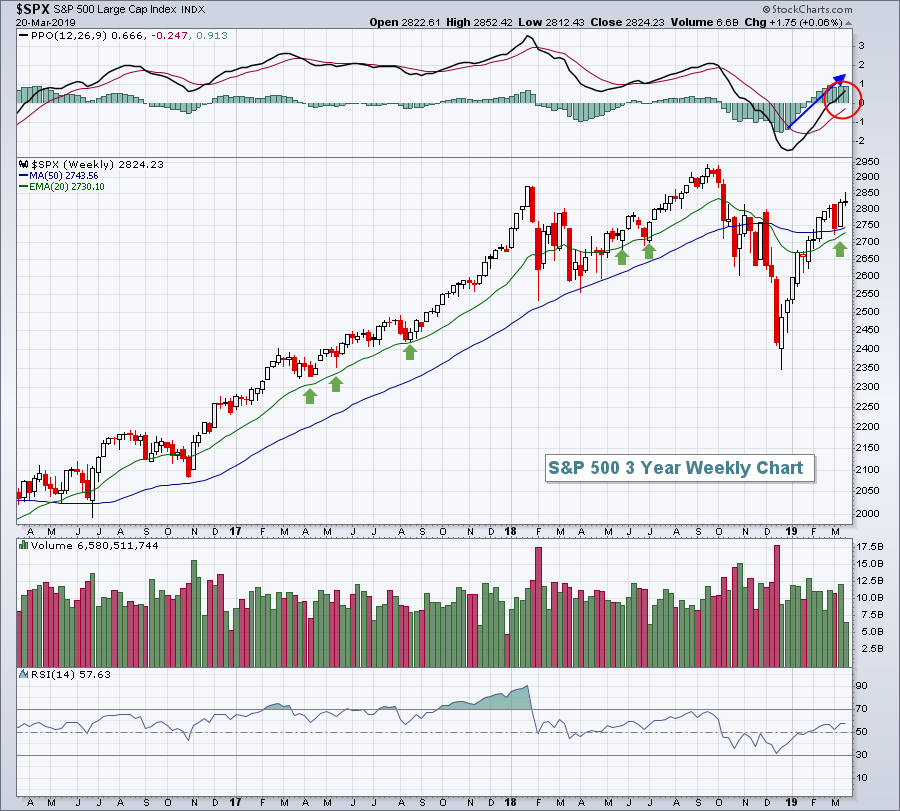
While I've discussed negative divergences this week that certainly concern me in the short-term, I'm not nearly as concerned in the longer-term.  The Volatility Index ($VIX) dropping back into the 12s recently is a signal that fear has dissipated to the point where it's quite unlikely we're in a bear market - even if you considered the Q4 market drop to be a cyclical bear market - which I do.  Technically, the bear market doesn't end until the S&P 500 is able to clear prior tops and move into all-time high territory.  But I would not trade by bear market rules.  The divergences indicate the possibility of short-term selling or consolidation, but I'd now watch the rising 20 week EMAs for excellent longer-term support on the benchmark S&P 500:

1553171827407626117543.pngIt's also worth noting that during the two prior bear markets, 2000-2002 and 2007-2009, the weekly PPO never crossed the centerline.  Bear market rallies do not typically last long enough to see the weekly PPO make that bullish crossover.  Nonetheless, the bond market action should provide all of us reason for concern.

https://stockcharts....ish-signal.html


#8 da_cheif

da_cheif

    Member

  • Traders-Talk User
  • 10,960 posts

Posted 22 March 2019 - 04:56 AM

yawwwwnn   675 ono     


#9 dTraderB

dTraderB

    Member

  • Traders-Talk User
  • 17,161 posts

Posted 22 March 2019 - 07:16 AM

Early bird catches the worm, they say.


Catching a few worms pre-cash session with some good NQ moves


#10 dTraderB

dTraderB

    Member

  • Traders-Talk User
  • 17,161 posts

Posted 22 March 2019 - 07:23 AM

From WSJ:


Key Events

IHS Markit's flash U.S. manufacturing index for March is expected to hold at 53.0. It is out at 9:45 a.m. ET.

U.S. existing-home sales for February, out at 10 a.m., are expected to rise to an annual pace of 5.10 million from 4.94 million a month earlier. 

The Baker-Hughes rig count will be released at 1 p.m. 

The U.S. federal budget deficit for February is expected to widen to $227 billion from $215 billion during the same month a year earlier. It it slated for 2 p.m.

The Atlanta Fed’s Raphael Bostic speaks on the economy and monetary policy at 9:30 p.m.


Market Facts
  • The S&P 500 logged its fifth rise of at least 1% Thursday since its last decline of more than 1% on Jan. 22. The advance put the index at a fresh five-month high, up 14% for the year and within 2.6% of its September record. 
     
  • With its latest rally, the S&P 500 information technology sector has risen 21.08% this quarter, on track for its largest quarterly advance since March 2012, according to Dow Jones Market Data. A rally greater than 21.14% would mark the best quarter since 2002. The group is now just 1.1% below last year's all-time high.  
     
  • Apple share rose for the ninth time in the last 10 sessions Thursday, surging 3.7% to give the company a market value of $920 billion. The company was close to regaining the title of largest U.S. company for the first time since early February before Microsoft climbed late in the day to finish with a market cap of $922 billion.