Jump to content


Photo

ST, IT short but bears fail to press home the advantage


  • Please log in to reply
28 replies to this topic

#1 dTraderB

dTraderB

    Member

  • Traders-Talk User
  • 17,399 posts

Posted 25 March 2019 - 07:12 PM

Just to put this in perspective: SPX is still above the 50ma (black) & 200ma (magenta), a mere 2% from the recent highs, and 

the 50ma is racing upwards to embrace and ?? the 200ma - will it be kiss and down again or kiss at cross over? 

Many watch this Golden Cross event with bated breath, not me. 

Both ST and IT SPX are short but ST can reverse with a daily close above 2807 and IT can reverse with a daily close above 2816

The 10-yr yield is scaring the daylights out of many, the politics seem to be settling down again post-Mueller, and there was even a minor TRADE WAR news item. 

I still think the market goes down from here but NOT IN A STRAIGHT LINE. 

55845466_10156713005455783_7989814995166


#2 dTraderB

dTraderB

    Member

  • Traders-Talk User
  • 17,399 posts

Posted 25 March 2019 - 07:13 PM

@Schuldensuehner
FollowFollow @Schuldensuehner
More

The scariest chart of these days. US 10y yields in free fall. Plunges to 2.42%, lowest since 2017.

D2guY_0WoAAjfSS.jpg
7:34 AM - 25 Mar 2019


#3 dTraderB

dTraderB

    Member

  • Traders-Talk User
  • 17,399 posts

Posted 25 March 2019 - 07:14 PM

@Schuldensuehner
FollowFollow @Schuldensuehner
More

US 10y yields extends drop, Falls below 2.4%, lowest since 2017.

D2hjfwsW0AMFBdG.jpg
11:26 AM - 25 Mar 2019


#4 dTraderB

dTraderB

    Member

  • Traders-Talk User
  • 17,399 posts

Posted 25 March 2019 - 07:18 PM

Hmm... lots of room up there !


Tom McClellan @McClellanOsc
FollowFollow @McClellanOsc
More

The comparison to 1993-95 got off track in Q4 of 2018, but appears to be back to working nicely again now.

D2h2CjeU4AAYzB7.png
12:48 PM - 25 Mar 2019


#5 dTraderB

dTraderB

    Member

  • Traders-Talk User
  • 17,399 posts

Posted 25 March 2019 - 07:21 PM

Below zero


 McClellanOsc_505.gif


https://www.marketin...llan-oscillator


#6 dTraderB

dTraderB

    Member

  • Traders-Talk User
  • 17,399 posts

Posted 25 March 2019 - 07:23 PM

The False Breakout

Posted 

March 25, 2019  by Joshua M Brown

Did a lot of bullishness just get trapped above 2815, the S&P 500’s previous resistance level that appeared to have been vanquished recently? Here’s Jon Krinsky of Baycrest Partners with my Chart o’ the Day:

Screen-Shot-2019-03-25-at-10.25.36-AM-10

Jon goes on to note that “Overall breadth remains a concern (just 38% of R3K above 200 DMA), and Friday’s 87% NYSE down volume day (highest since Dec. 4 th) is perhaps indicative of sellers waking up.”

Source:

From False Moves Come Fast Moves 
Bay Crest Partners – March 24th 2019 

https://thereformedb...-false-breakout


#7 dTraderB

dTraderB

    Member

  • Traders-Talk User
  • 17,399 posts

Posted 25 March 2019 - 07:30 PM

Closing my 2 NQ longs, + 22.5 points per lot

People seem to be fixated and scared of the bond yield, inverted curve, and anything related

Bond market says not only is a recession coming, but the Fed will cut interest rates to stop it
  • Fed funds futures were pointing to a quarter point in easing Monday, as traders said scary signals continued to emanate from the bond market.
  • On Friday, there was a so-called inversion in the yield curve, meaning very short rates rose above longer 10-year note rates, a fairly reliable recession signal.
  • Traders say the bond market may be overreacting, while stocks seem to be ignoring the recession warnings and fears the Fed will have to jump in with one or more rate cuts to stop the economy from rolling over.

https://www.cnbc.com...-cut-rates.html


Samsung warns first-quarter earnings will fall short of expectations


  • Samsung Electronics says it expects first quarter earnings to fall short of market expectations due to weak memory and display businesses. 


#8 dTraderB

dTraderB

    Member

  • Traders-Talk User
  • 17,399 posts

Posted 25 March 2019 - 07:37 PM

Tom thinks we test the 50ma 


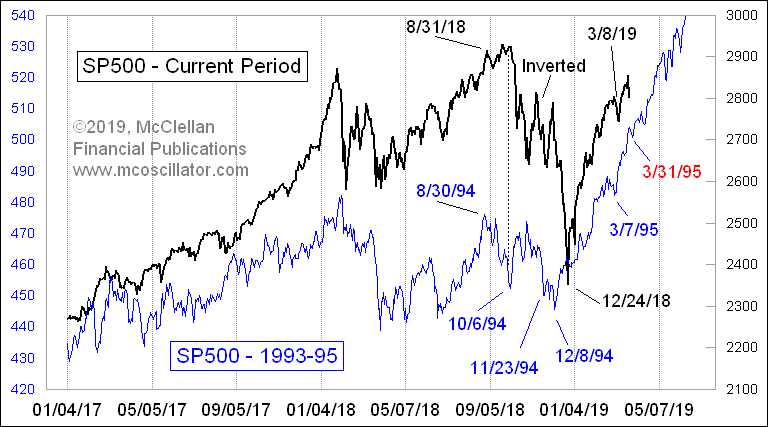
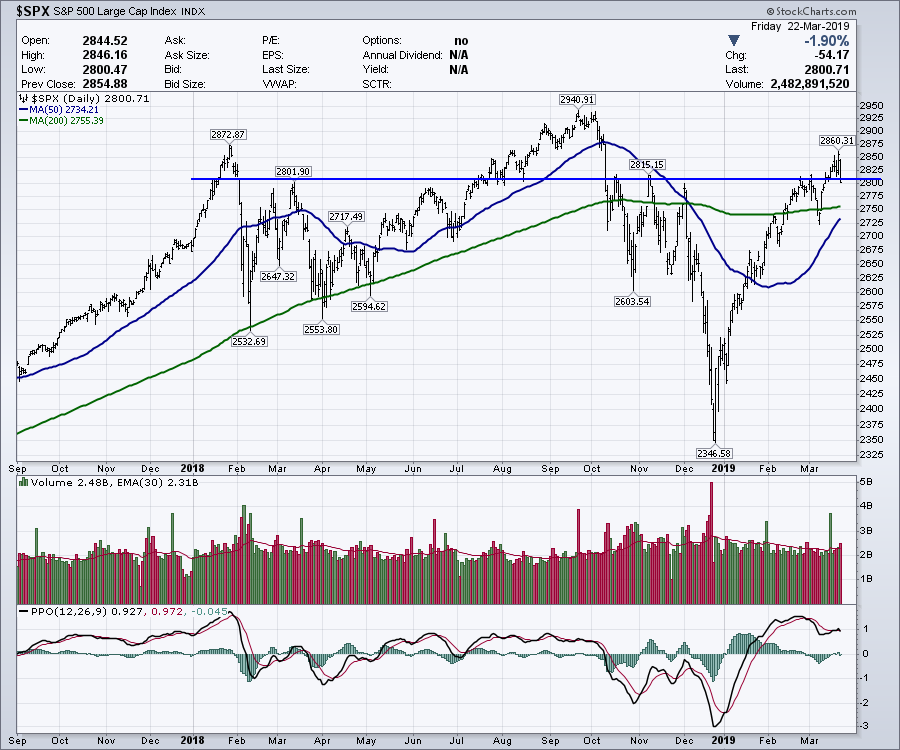
Investors were worried on Friday and it was reflected in the Volatility Index ($VIX), which rose more than 20%, and sharply lower U.S. equity prices.  The small cap Russell 2000 was hit hardest, dropping 3.62%.  The weakness, however, was felt just about everywhere.  The NASDAQ, S&P 500 and Dow Jones fell 2.50%, 1.90%, and 1.77%, respectively, as negative divergences kicked in.  I wrote last week about moving to cash as warning signs were mounting.  My blog article last Tuesday, "Negative Divergences Could Wreak Havoc On U.S. Stocks", discussed slowing momentum signals and a possible trip to test the rising 50 day SMA.  We're on our way as you can see from this S&P 500 chart:

15535154072871070649739.png
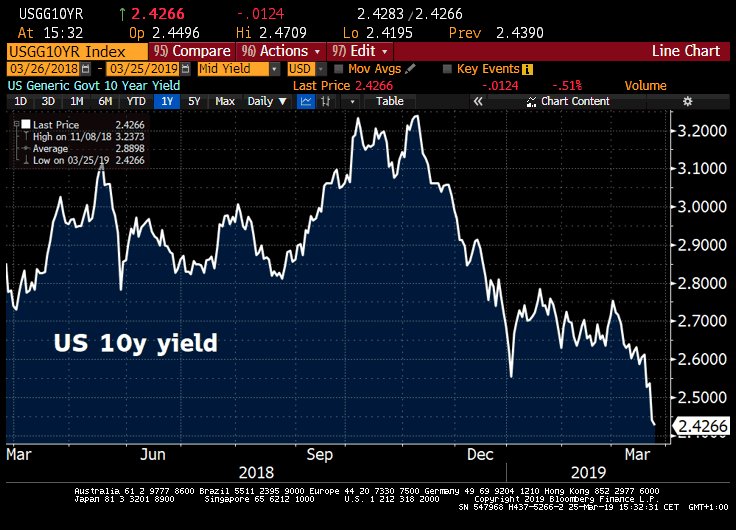
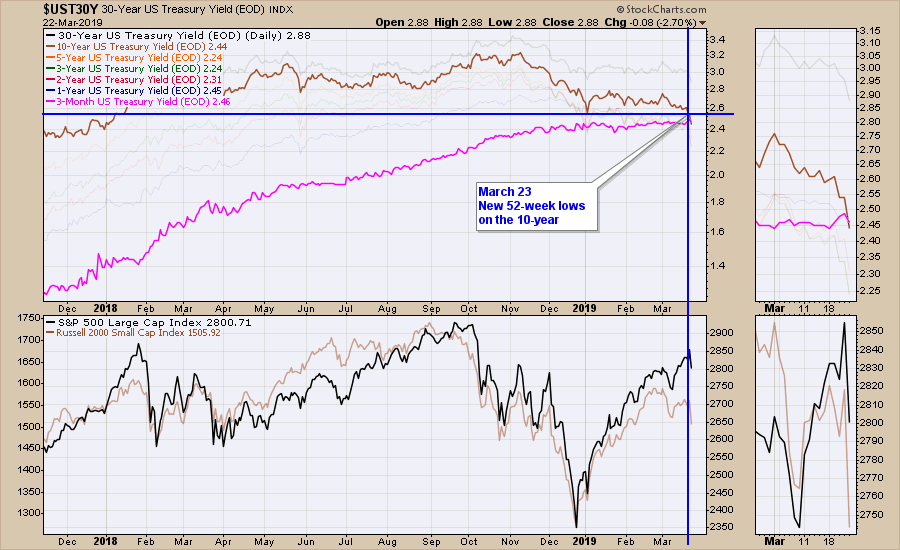
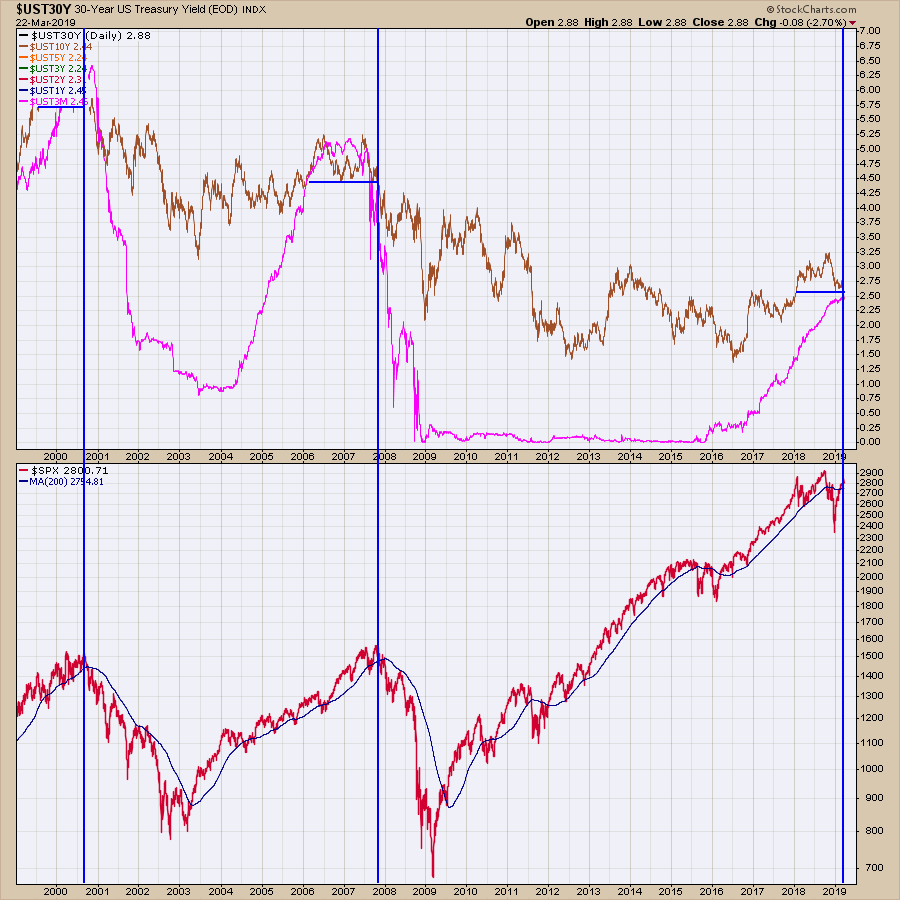
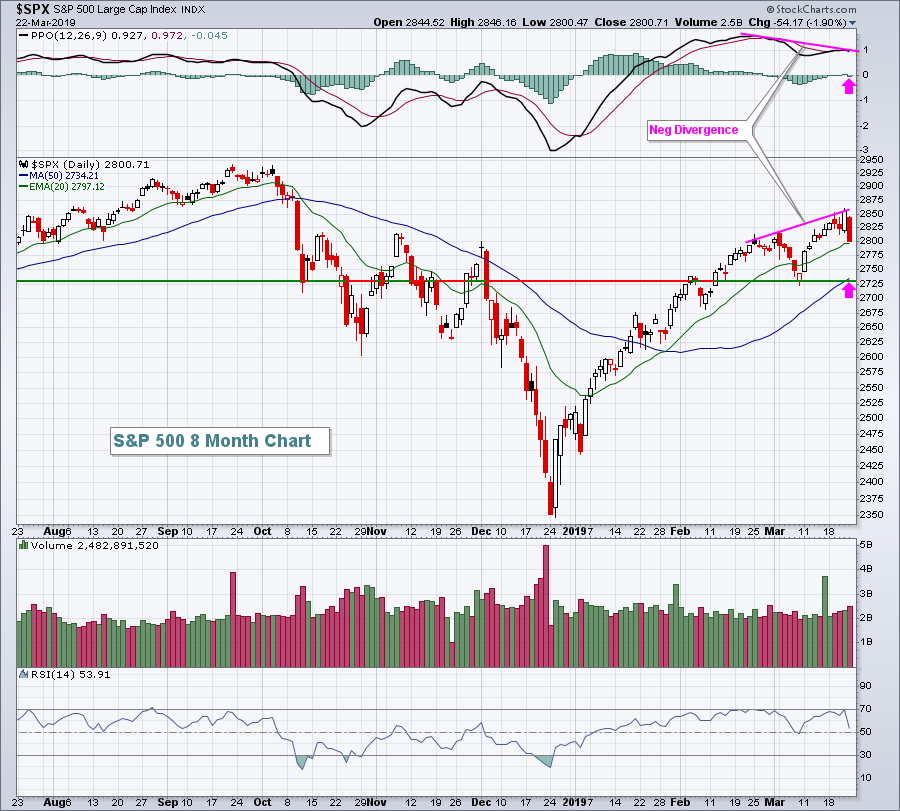
Also, market action the week after monthly options expire is generally not very good.  Throw in the tumbling treasury yields, which I also warned about last Thursday in my article, "The Bond Market Is Sending Us The Most Bearish Signal", and it's clear we need to be cautious in the very near-term.  Technical analysis never provides us a guarantee that anything will occur, but it does tell us a story.  The plot of the current story says to be very, very careful.  For me, the most important consideration, bar none, is the combination of price support/resistance and volume.  The recent price low on the S&P 500 is close to 2730.  The rising 50 day SMA is currently at 2734.  During an uptrend, the rising 20 week EMA also provides excellent support and it currently resides at 2728.  Clearly, this is an important area to watch on further selling.  We know that impulsive selling tends to occur with a VIX above 20 and price support lost.  Therefore, I'd grow even more cautious if you see the VIX spiking further and the S&P 500 moving (and closing) beneath the 2725 level.

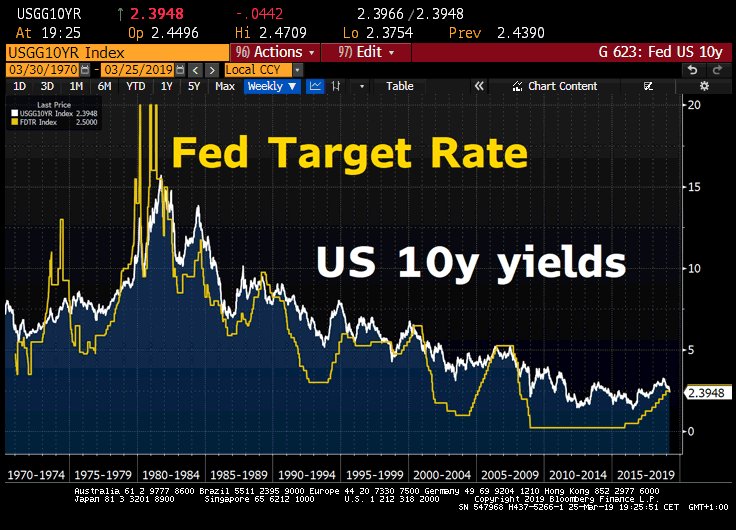
Economic weakness abroad has become very clear.  The European Central Bank (ECB) was slower to act than the Federal Reserve, but it is on a program of quantitative easing (QE) to help spur economic activity in Europe. On Friday, the German PMI manufacturing number fell to 44.7, well below the 50 threshold that suggests economic contraction.  One big concern in the U.S. is that economic weakness in Asia and Europe will lead to a recession here and the inversion of the yield curve last week increased the odds of that.  However, the rate of change (ROC) in U.S. jobs is generally a very good economic indication and, despite the February job slowdown, the ROC remains quite strong.  I'd be very patient at this time before making any longer-term prediction about the direction of U.S. equity prices.  I believe we remain in a secular bull market with higher prices ahead.  Could we see weakness and/or consolidation in the foreseeable future?  Absolutely.  In fact, the bond market is arguing for exactly that.

10 of 11 sectors fell on Friday, with only the defensive utilities group (XLU, +0.72%) gaining ground.  The combination of a strengthening U.S. Dollar Index ($USD, +0.17%) and growing worldwide economic fears resulted in underperformance by materials (XLB, -2.98%) and energy (XLE, -2.70%).  These two sectors, especially materials, will likely remain under tremendous pressure on a relative basis.  The strong dollar almost guarantees it.  Financials (XLF, -2.76%) also performed very poorly as the inversion of the yield curve creates tremendous headwinds for areas like banks ($DJUSBK, -3.74%) and life insurance companies ($DJUSIL, -3.32%).

https://stockcharts....idays-drop.html


#9 dTraderB

dTraderB

    Member

  • Traders-Talk User
  • 17,399 posts

Posted 25 March 2019 - 07:40 PM

I have been reading this again....reposting:


Present day, 2019.

Both conditions were met the week of March 18. On March 22, the 10-year yield closed below the 3-month yield. Secondly, the 10-year yield made a new 52-week closing low on Friday, March 23rd.

15534782677701734023824.pngA close up look at the $SPX. Notice the 10-year closed at a new 52-week low while the market was rallying into another contentious level. 

1553478455231353439222.pngIn summary, it looks like a top and it feels like a top. The settings are all the same. Not just any top. Topping that marked significant drawdowns over the next few years and the two previous examples wiped out 50% of the account values each time.

Sometimes, it feels like a similar condition. In this case, it has all the makings across the asset classes. Plummeting bank stocks, plummeting yields, global slowdowns, and weak commodities. If it follows through, it is very important ! Nothing is for sure, but the logic of compression on the entire yield scale, the 10-year crossing below the 3-month and the 10-year yields making new 52-week lows is pretty compelling. It's only happened twice in this century. Friday marked the third time. 

While it is a small sample size, it is worthy of paying attention!!

1553481697333775800108.pngThere is a lot more information why Friday was so concerning, and you can find that article and video here. 

Has A Big Bear Market Rally Just Finished?  2019-03-23 Weekly Market Roundup

I also wrote an article October 15th, 2018 that you might be interested in as well. 

Zooming Out - Is A Major Top In ? 2018-10-15

https://stockcharts....oks-severe.html


#10 dTraderB

dTraderB

    Member

  • Traders-Talk User
  • 17,399 posts

Posted 25 March 2019 - 07:43 PM

Of course, NOT!  

But their shambolic performance is worrying many !


Sentiment Speaks: Has The Fed Finally Lost Control Of Interest Rates?
Summary

The Fed is not in control as much as most believe.

The bond market is a leading indicator for Fed action.

I am still bullish on TLT.

https://seekingalpha...-interest-rates