What the Yield Curve Inversion Means for 2020
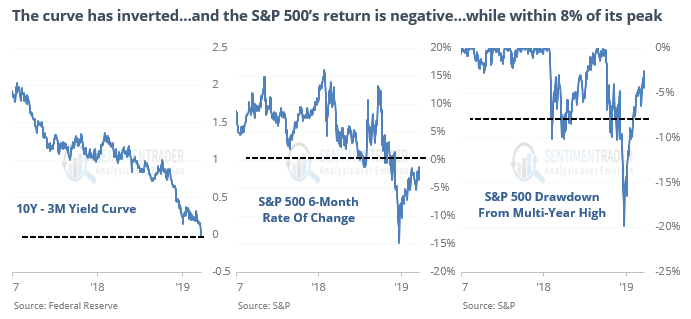
Forgive us for harping on Friday's yield curve inversion for one more day. But, historically, the event has been a reliable recession indicator and stocks have reacted accordingly. After past inversions, economic expansion turned to contraction about four to six quarters later.
If the curve remains inverted for an extended period and the relationship holds up again this time around, it suggests that a recession is set to appear right before the 2020 presidential election, Barron's' Ben Levisohn observed today. Who does that presumably serve?
We don't claim to be politics experts here, but we can certainly look at past situations and draw parallels to today. And Deutsche Bankstrategist Alan Ruskin did just that. As Ben wrote:
Two examples stand out: Ronald Reagan’s win in 1980 and Barack Obama’s victory in 2008. In both cases, the yield curve had inverted meaningfully, and the economy had slipped into deep recessions by the time of the election. In both cases, the incumbent party lost. “On both occurrences we know, that at the time of the election, the economy was in unusually poor shape, almost certainly encouraging the Reagan 1980 and Obama 2008 wins,” Ruskin writes.
A flat or steep curve doesn't have any meaningful predictive power, according to Ruskin, with both incumbents and challenger candidates winning.
An inverted yield curve's far-out predictive power is interesting, however. “Currently, the curve’s message is rather simple and suggests that come the 2020 election, the electorate may well be demanding new economic ideas in the face of a slowing economy, that in turn may produce more ‘out of the box’ thinking than in traditional campaigns," Ruskin writes.
Read Ben's full report here.