Jump to content


Photo

SPX Golden Cross: catalyst to NEW HIGHS?


  • Please log in to reply
26 replies to this topic

#1 dTraderB

dTraderB

    Member

  • Traders-Talk User
  • 17,282 posts

Posted 30 March 2019 - 11:13 AM

It's here, about to happen: the great Golden Cross where the 50ma (BLUE)  crosses over the 200ma YELLOW), and both are rising..


IS this the catalyst to NEW HIGHS?


I think not but I could come on board if SPX closes above the recent swing daily high and then moves quickly above SPX 2880. 

The more likely path I forecast is a drop to SPX 2660 or lower.


Those are the two obstacles on the way. 


VIX overlaid is represented by those faded bars. 


55560607_647007055721297_737325580541755


#2 dTraderB

dTraderB

    Member

  • Traders-Talk User
  • 17,282 posts

Posted 30 March 2019 - 11:16 AM

Helene Meisler @hmeisler
FollowFollow @hmeisler
More

10dma of Equity put/call ratio with SPX

D26gS0zX4AUCrP_.png
7:43 AM - 30 Mar 2019


#3 dTraderB

dTraderB

    Member

  • Traders-Talk User
  • 17,282 posts

Posted 30 March 2019 - 11:17 AM

Helene Meisler @hmeisler
FollowFollow @hmeisler
More

New highs on Naz

D26PyqfWoAAhyNl.png
6:31 AM - 30 Mar 2019


#4 dTraderB

dTraderB

    Member

  • Traders-Talk User
  • 17,282 posts

Posted 30 March 2019 - 11:20 AM

Helene Meisler @hmeisler
FollowFollow @hmeisler
More

SPX should have a Golden Cross Monday. Now less than 1 point apart. @BullandBaird

D26M9HpXQAAs6Xm.png
 
Replying to @hmeisler @BullandBaird

I found it very unsettling that the FED and Trump admin were pumping up markets all week w trade talk and dovish policy. Still couldn’t take us above 2830/2840 $SPX. Q2 start next week will be interesting. Will the ‘golden cross’ take us higher? End of quarter window bid gone...


  • Isn't early April seasonally strong? Not my thing but I vaguely recall it is

    1 reply0 retweets3 likes
    Reply
     1
     
    Retweet


    Like
     3
     
    Direct message


  •  

    You are right... April is seasonally strong. But after a double digit run up in Q1. I will be interested to see where the $SPX goes from here. A lot of pumping the stock market by FED & Trump admin (trade talk) this week. Price action is all that matters in the end right?

    D26RIQNXgAAIMDg.jpg
    1 reply0 retweets0 likes
    Reply


#5 dTraderB

dTraderB

    Member

  • Traders-Talk User
  • 17,282 posts

Posted 30 March 2019 - 11:22 AM

hedgopia @hedgopia
FollowFollow @hedgopia
More

#HedgeFunds switch back to net long $SPX futures. This, after 9 wks of staying short. Cash, just north of resistance at 2800-plus, up 1.2% for wk.

D22msPSUkAAx9kg.jpg
1:33 PM - 29 Mar 2019


#6 dTraderB

dTraderB

    Member

  • Traders-Talk User
  • 17,282 posts

Posted 30 March 2019 - 11:23 AM

hedgopia @hedgopia
FollowFollow @hedgopia
More
D26S4qHUwAA8Z4D.jpg
6:45 AM - 30 Mar 2019


#7 dTraderB

dTraderB

    Member

  • Traders-Talk User
  • 17,282 posts

Posted 30 March 2019 - 11:25 AM

LOL


zerohedge @zerohedge
FollowFollow @zerohedge
More

Kudlow Calls For "Immediate" 50bps Rate-Cut - Signals Imminent Recession

https://www.zerohedg...inent-recession


#8 dTraderB

dTraderB

    Member

  • Traders-Talk User
  • 17,282 posts

Posted 30 March 2019 - 11:27 AM

BUT what did LARRY say, see post above...


@Schuldensuehner
FollowFollow @Schuldensuehner
More

One quarter can change anything: Risk mkts signal now a way lower recession probability after strong rally in equity, credit and commodities over past quarter. BUT there appears to be disconnect between rate and risky markets w/ rate mkts signaling more elevated recessions risks.

D25Bp0dWkAAHb0P.jpg
2:07 AM - 30 Mar 2019


#9 dTraderB

dTraderB

    Member

  • Traders-Talk User
  • 17,282 posts

Posted 30 March 2019 - 11:28 AM

@Schuldensuehner
FollowFollow @Schuldensuehner
More

This chart partly explains the rally of stocks and bonds in Q1. Central Banks have pumped almost $1tn in liquidity into global markets.

D24_UtwWkAAYG0H.jpg
3:07 AM - 30 Mar 2019


#10 dTraderB

dTraderB

    Member

  • Traders-Talk User
  • 17,282 posts

Posted 30 March 2019 - 03:16 PM

Yield Curve inversion? No problem, don't worry, be happy.....


Ignore The Yield Curve, They Said… 03-30-19

Written by Lance Roberts | Mar, 30, 2019

Not surprisingly, historically speaking, investors had their peak stock exposure before the market cycle peak. As the market had its first stumble, investors sold. When the market bounces, investors are initially reluctant to chase it. However, as the rally continues, the “fear of missing out or F.O.M.O” eventually forces them back into the market. This is how bear market rallies work; they inflict the most pain possible on investors both on the bounce and then on the way back down.  

However, for the moment, we are still in the midst of a bear market rally. This will be the case until the market breaks out to new highs. Only then can we confirm the previous consolidation is complete and the bull market has been re-established. 

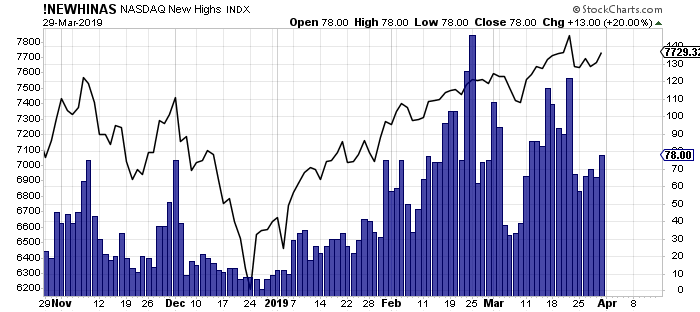
The good news is on a very short-term basis, the market IS INDEED bullishly biased and coming off an extremely strong first quarter rally. The current momentum of the market is strong as bullish optimism has regained a foothold.

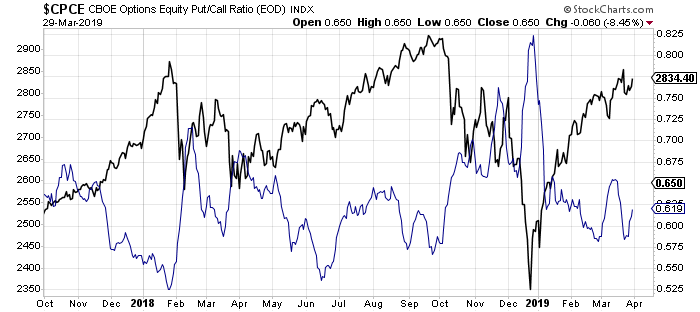
But, as we noted for our RIA PRO Subscribers last week, (Free 30-Day Trial with Code: PRO30) complacency has moved back to extremes which suggests that a further rally isn’t “risk free.” 

“The graph below is constructed by normalizing VIX (equity volatility), MOVE (bond volatility) and CVIX (US dollar volatility) and then aggregating the results into an equal-weighted index. The y-axis denotes the percentage of time that the same or lower levels of aggregated volatility occurred since 2010. For instance, the current level is 1.91%, meaning that only 1.91% of readings registered at a lower level.

1-5.png

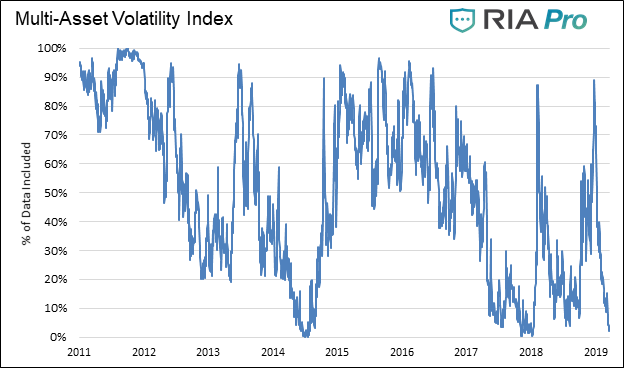
“Beyond the very low level of volatility across the three major asset classes, there are two other takeaways worth pondering.

The peak -to- trough -to- peak cycle over the last year was measured in months not years as was the case before 2018.

Secondly, when the index reached current low levels in the past, a surge in volatility occurred soon after that. This does not mean the index will bounce higher immediately, but it does mean we should expect a much higher level of volatility over the next few months.”

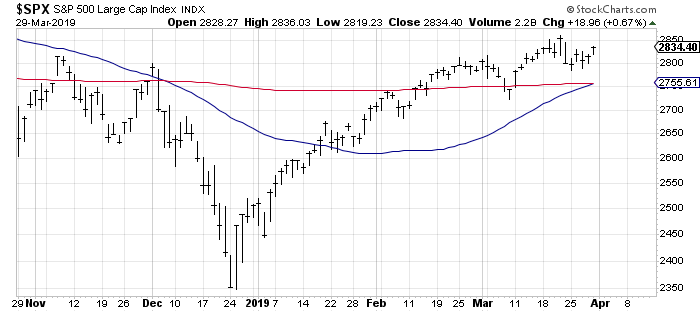
Nonetheless, the markets are close to registering a “golden cross.” This is some of that technical “voodoo” where the 50-day moving average (dma) crosses above the longer-term 200-dma. This “cross” provides substantial support for stocks at that level and limits downside risk to some degree in the short-term. 

SP500-Chart3a-032919.png

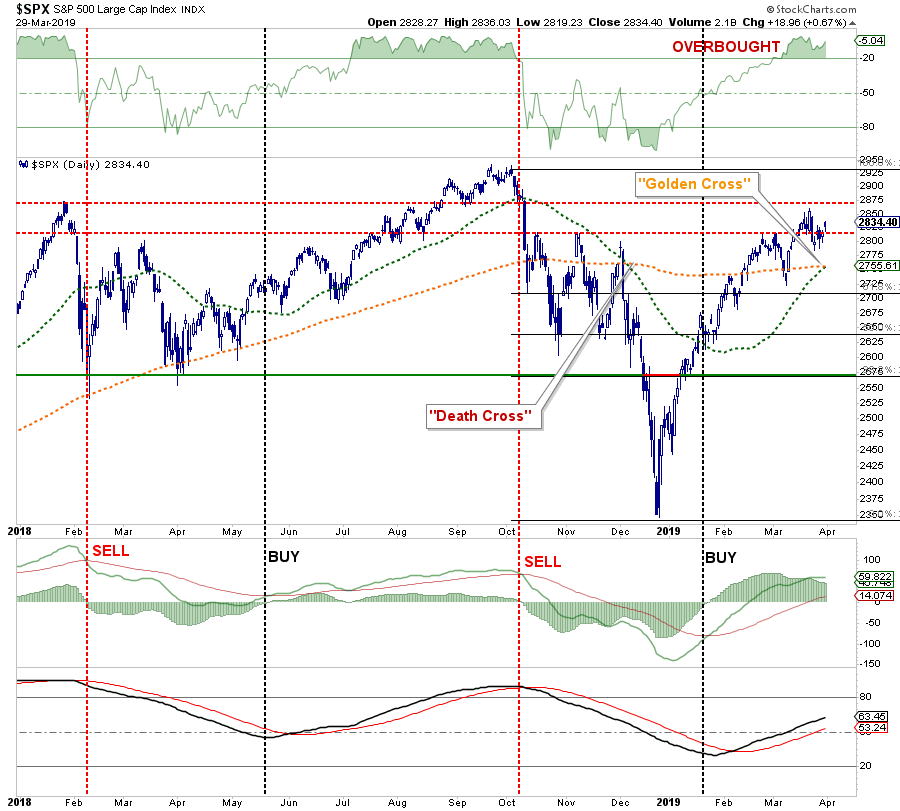
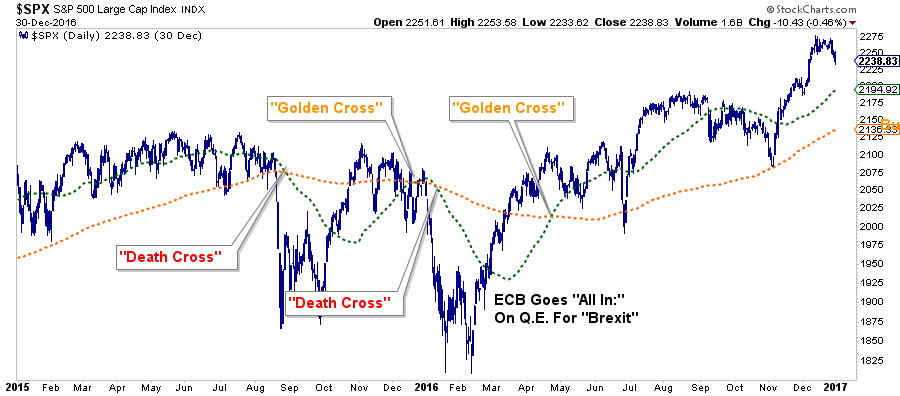
Over the next couple of weeks, you are going to see a LOT of commentary about “the Golden Cross” buy signal and why this means the “bull market” is officially back in action. While “golden crosses” are indeed bullish for the markets, they are not an infallible signal. The chart below shows the 2015-2016 market where investors were whipsawed over a 6-month period before massive Central Bank interventions got the markets back on track. 

SP500-Chart4a-032919.png

The next chart shows the longer-term version of the chart above using WEEKLY data. The parameters are set for a slightly longer time frame to reduce the number of “false” indications. I have accentuated the moving averages to have them more clearly show the crosses.

https://realinvestme...y-said-03-30-19