Jump to content


Photo

ST & IT LONG, SPX 2900 this week?


  • Please log in to reply
20 replies to this topic

#1 dTraderB

dTraderB

    Member

  • Traders-Talk User
  • 17,088 posts

Posted 01 April 2019 - 04:48 PM

Technically, this is now a very strong market. 

50ma easily crossed above the 200ma and a new daily swing high was made today, the highest since last September.


Fundamentally, good news from China but not so good here and in Europe. 

Italy & Turkey are also very suspect. 


The markets are extended and VIX/VXXB are not diving as much as last year when the markets zoomed ahead. 

Mo


Unless there is a major bearish event, SPX could reach 2900 this week. 
However,  I am looking for strong resistance in the SP 2880/1900 zone, AND, dare I say it: an IT top.


ED YARDENI says not worry about recession, the FED is doing what has to be done to ensure there will be none, soon:


(NO, this is not an APRIL 1 prank)


Opinion: This is the real reason why the U.S. economy isn’t in recession danger now

Yardeni: Credit crunches cause recessions — and the Fed isn’t raising interest rates


https://www.marketwa...-now-2019-04-01


#2 dTraderB

dTraderB

    Member

  • Traders-Talk User
  • 17,088 posts

Posted 01 April 2019 - 04:51 PM

On the other hand, this guy says LOOK OUT BELOW!

How bad can it get for the S&P 500?

It’s not the inversion of any single Treasury pair that should worry us, says Crescat Capital macro analyst Otavio Costa. His fund topped the charts in 2018, returning more than 40%. The indicator to watch, he told MarketWatch recently, is the percentage of all Treasury pairs that display inversions. That percentage leapt to 60% last week from 0% just a couple of months ago. He’s predicting “a 40% decline from the S&P’s top.” That suggests the all-time high we saw on Sept. 20, 2018, may be the last one for a while.

None of this guarantees that the S&P 500 SPX, +1.16%  will go down this month or even this year. For one thing, we haven’t seen the outright euphoria that usually drives the market to a “climax top,” as in the 2000 dot-com mania and the 2007 housing bubble.

https://www.marketwa...-500-2019-03-29


#3 dTraderB

dTraderB

    Member

  • Traders-Talk User
  • 17,088 posts

Posted 01 April 2019 - 05:00 PM

Disappointing end to a good day; after an early start pre-cash session and a great morning session, G literally dozed off 

for about 2 hours during prime time afternoon trading!  Traded in a 20-point range for about 22 5-minutes bars before 

catching some buying in the last hour & then selling as cash closed


Added 4 QQQ puts and half-position VXXB long near the close.


No LT Portfolio buys because.... markets will be lower than SPX 2700 within the next 2 months.


Edited by dTraderB, 01 April 2019 - 05:04 PM.


#4 dTraderB

dTraderB

    Member

  • Traders-Talk User
  • 17,088 posts

Posted 01 April 2019 - 08:03 PM

LOL, if it were so easy & logical! 


@TaviCosta

FollowFollow @TaviCosta
More

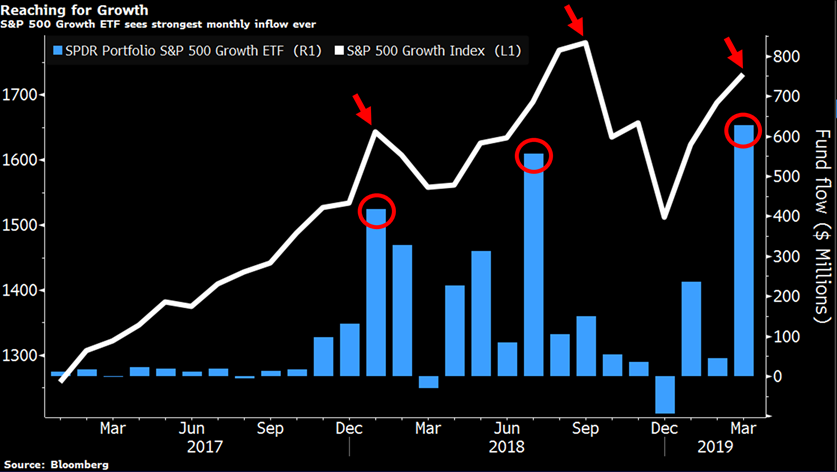
Largest monthly inflow to S&P 500 growth ETF ever! Previous inflow extremes also preceded significant market selloffs. Record bullishness at near record valuations can never a good sign. Credits to @jessefelder


D3GXdj4U0AEGxEI.png


Edited by dTraderB, 01 April 2019 - 08:03 PM.


#5 dTraderB

dTraderB

    Member

  • Traders-Talk User
  • 17,088 posts

Posted 01 April 2019 - 08:05 PM

@crescatkevin
FollowFollow @crescatkevin
More

VIX short positioning by speculators is more extreme than it was just prior to the market selloff in Q4 2018. Credit to @AndreasSteno

D3GdBRvVAAIaW5M.jpg
3:30 PM - 1 Apr 2019


#6 dTraderB

dTraderB

    Member

  • Traders-Talk User
  • 17,088 posts

Posted 01 April 2019 - 08:08 PM

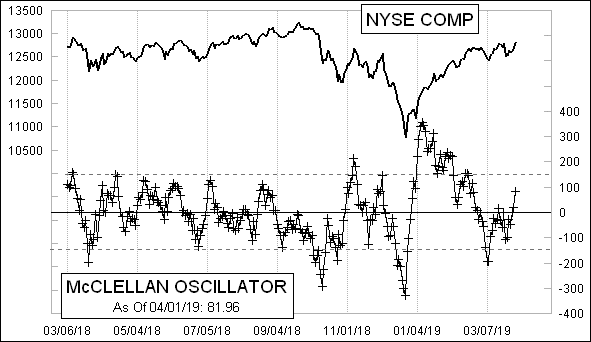
BULLISH, looks like it can run up some more


McClellanOsc_510.gif


https://www.marketin...llan-oscillator


#7 dTraderB

dTraderB

    Member

  • Traders-Talk User
  • 17,088 posts

Posted 01 April 2019 - 08:09 PM

Heavy lifting needed here to get this from under the water...


@Schuldensuehner
FollowFollow @Schuldensuehner
More

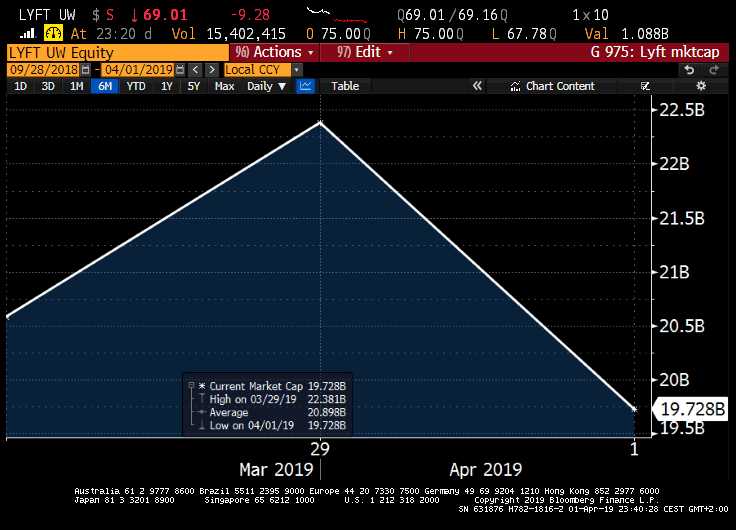
In the rental economy, the mkt cap is only borrowed as well. Lyft which started w/ a IPO mkt cap of $20.6bn that gained to $22.4bn has plunged to mkt cap sub-$20bn.

D3GV-OTXQAMqBGN.jpg
3:07 PM - 1 Apr 2019


#8 dTraderB

dTraderB

    Member

  • Traders-Talk User
  • 17,088 posts

Posted 01 April 2019 - 08:14 PM

Yeah, but who buys & holds DOWN for a year plus? 

That's why you DAYTRADE!


@ReformedBroker
FollowFollow @ReformedBroker
More

The Dow Jones has traveled 58,000 points, up and down, since peaking on January 17th 2018. It’s total gain since then? 40 points. That stat is 1f34c.png1f34c.png1f34c.png via ⁦@michaelbatnick


#9 dTraderB

dTraderB

    Member

  • Traders-Talk User
  • 17,088 posts

Posted 01 April 2019 - 08:15 PM

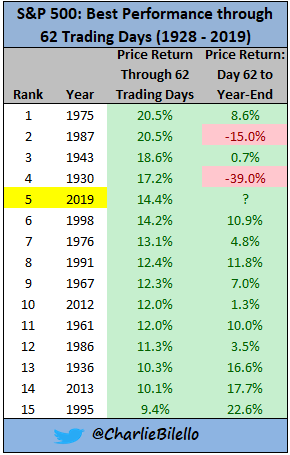
It's coming!  But, maybe not after new highs


@charliebilello
FollowFollow @charliebilello
More

S&P 500 up 14.4% in 2019, best start to a year since ... 1987. $SPX

D3GQF7cWwAA0LN-.png
2:28 PM - 1 Apr 2019


#10 dTraderB

dTraderB

    Member

  • Traders-Talk User
  • 17,088 posts

Posted 01 April 2019 - 08:16 PM

DOW powering ahead...to new highs


@charliebilello
FollowFollow @charliebilello
More

The Dow has rallied 22% from its Dec low and is now just 1% below its all-time high from last October (note: total return). $DJIA

D3GOC1kXcAgQWKT.png
2:19 PM - 1 Apr 2019