S&P 500 CASH
SPX CASH:
SEPT SP:
SPX CASH:
SEPT SP:
SPX CASH:
SPX CASH:
Current SPX Index Postures:
Mid-term (6-8 weeks) = 60% BULLISH from 1104 (avg price)
Short-term (1 day-3 weeks) = 40% BEARISH from 1104.35
From previous outlook: "Going down to thehourly charts, at Friday’s close the 36 hour cycle is 23 hours along; since we knowthat 80% of these have seen bottoms in the 29-43 hour range, this tells us that theprobabilities are above average for continued selling into Tuesday’s session and theearliest a low might form will be later in the day. Going to the daily projected supportand resistance numbers, note the new daily projected support low of 1109 SPX CASH, which Ithink should be at least be tested early this week, with the best shot then at some pointlater in Tuesday’s session. In addition, we also have a new weekly projected supportlow of 1104 SPX CASH, giving us a clustering of support then at the 1104-1109 region; ifthis holds off any early week decline in Tuesday’s session, then odds will favorhigher highs into late week and some test of the 1130-1131 weekly/monthly projectedresistance high region."
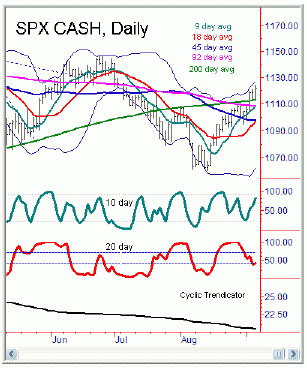
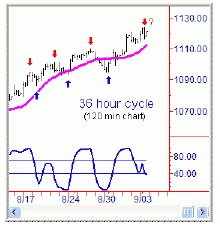
 | Current Outlook: The SPX did a head fake with the 36 hour cycle, opening gap higher to actually make new swing highs for the move, tagging 1124.08 at the intraday peak. From there prices sold off later in the day down to the 1116 region, then bounced back into the close to still end the session higher. Volume today was definitely an improvement to the low volume action we have seen in the last week or two; 1.21 billion shares were traded today, which is about a 23% increase from the numbers seen in Friday’s session, which suggests a higher high above 1124 will be seen after any retracement lower. Shorter-term, the 36 hour cycle looks like it saw an extended top, peaking at the 1124 swing top in today’s session; if correct, then the 36 hour moving average should act as a magnet for price in the next day or two as this cycle bottoms out. |
| There is also a futures gap left from the 1114 region from Friday’s close, which should also act as the price attractor as this hourly cycle bottoms out in the coming days. We are 30 hours along at today’s close, with a normal bottoming range for the 36 hour cycle component in the 29-43 hour range, which suggests the low for this cycle will be seen in Wednesday’s session. |  |
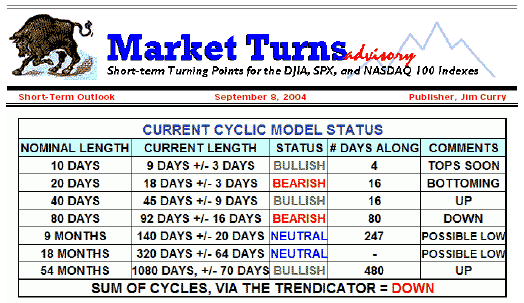
Stepping up a timeframe, the drop into the 1094 swinglow from last week we know has a low odds of being a 20 day cycle bottom, which means thatthe market is at risk to a decline in the neighborhood of 2% or greater in the next weekor so. Since we also know that cycles can expand or contract, it will be near impossible to predict from what number the 20 day top will occur, though the action fromvolume now suggests it will be from a higher number than 1124.08
SPX CASH. One additional note is that any move abovethe 1124.08 area on the SPX will confirm an upside target with the 10 day cycle to1135-1143 SPX CASH - making this number key area for the short term in Wednesday’ssession. Look for the index to be weaker below and stronger above.
NASDAQ 100 CASH
Daily Projected Support andResistance levels: High, 1386 - Low, 1368
5-Day Projected Support and Resistance levels: High, 1386 - Low, 1339
Monthly Projected Support and Resistance levels: High, 1388 - Low, 1281
Current NDX Index Postures:
Mid-Term (6-8 weeks) = 60% BULLISH from 1367.50
Short-term (1 day - 3 weeks) = 100% BULLISH from 1378.99
From previous outlook:
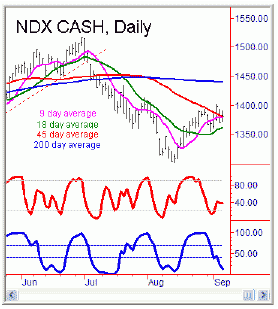
"the36 hour cycle is 23 hours along at Friday’s close on this index as well; with 80% ofthese smaller cycles bottoming in the 29-43 hour range it tells us that, at the earliest,a low should not really form with the minor cycles until late in Tuesday’s session;in other words, odds will favor a lower low near the 1360 area early this week -regardless of whether the index holds this level for a run to new swing highs by lateweek."Current analysis: Unlike the SPX, the NDX did not make new swing highs for the move in today’s session, tagging 1390 at the session peak before consolidating lower into late afternoon. Volume here also came in at the 1.3 billion share range, which is better than Friday’s numbers, though still light for this index. Interestingly, the increased volume seen on Friday still suggests another test of the 1360 area may be coming in the next few ays, though I now see that area as a wall of short term support. In other words, I think the 1360 region should hold any near term downside, and that this index should soon try and reassert itself towards the outstanding upside target with the 10 day cycle to 1408-1433. |  |
Jim Curry
Market Turns Advisory
Email: jcurry@cycle-wave.com


