September 2 interview with Ike Iossif http://marketviews.tv/freeservices/archives1/Guests/Ord/pg1.htm
*Look for Tim's article in theMay issue of the "Stock and Commodities Magazine".
Interviewwith Leo Leydon For Monday September 8, http://financialfocusadvisoryservices.com/radio.html-click archive for Monday.
"TimerDigest" has "The Ord Oracle" ranked #3for the three month time frame for the S&P ending 6/21.
For 30 to90 days horizon: Long SPX (8/10/04) at 1079.04.
Short termtrades, one day to one-week horizon: Flat.
We have "800" phone updatethat cost $2.00 a min. and billed to a credit card. Call(1-970-224-3981) for sign up. We update Eastern time at 9:45; 11:30; 1:30; 3:30 and 4:00.Question? Call me (402) 486-0362.
What toexpect now:
The S&P "Jumped above the July21 of 1116 last Thursday on lighter volume. Sincethe "Jump" was on lighter volume and is a short term bearish sign, the marketmay stall near current levels. There issupport at the previous high set at the 1109 level, which is not much downside from thecurrent level. The NYSE Summation is trendingup and implies the trend is up. A majorbullish signal was triggered on the McClellan Summation index at the May low where theSummation index traded below the -1500 level and then proceeded to rally to +3000triggering a major bullish signal. The pullback into the August low near the 1060 level on the S&P 500 in our opinion was are-test of the May low, Even-though the S&P hit a minor new low. Both the S&P 400 (mid Cap) and the S&P 600(Small Cap) have broke there long term resistance levels back in October of 2003 and theseold resistance levels now act as support. Onthe S&P 400 that support level comes in at the 550 level which was hit in mid August. The longer term target on the S&P 400 for thenext major high comes in near the 800 level, which is 38% higher then where we are now. That equates to over 1500 on the S&P 500 whichis the old 2000 highs. A similar study andoutcome is also predicted on the S&P 600. Graphof the S&P 400 is provided by "decisionpoint.com". Therefore we are bullish in the months to come.
We like HPC and is in the Chemicalsector. Strong support lies near the12.25 range and good support lies at the 13.25 range. We bought this stock at 13.73. First upside target is 20 then after that it's 27. All most all sectors look fine except the"Semiconductors" and the "Technology index". The Nasdaq is full of the Tech's and is the reasonwhy Nasdaq is weaker then the S&P. Wewill be picking more stocks shortly.
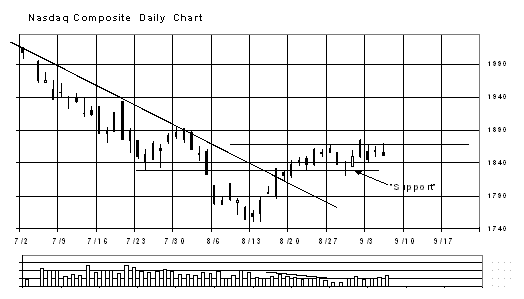
Nasdaq Composite:
We double our positions in BGO on(7/30/04) at 2.34 and we now have an average price at 2.70. Long CBJ for an average ofprice of 2.89. CBJ is on a monthly buy signalfrom the May low. Long NXG average of 2.26.NXG has support at 1.35. NXG is on a buysignal on the monthly chart that was triggered in May. We doubled our position in GSS on (7/30/04)at 4.04 and we have an average price of 5.24. LongPMU at average 1.12.
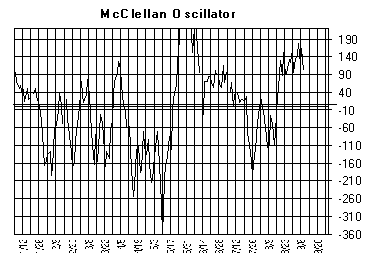
The McClellan Oscillator closedat -366 on May 10 and in an area where previous intermediate term lows has occurred. Today's close came in at +99 and overbought forthe short term.
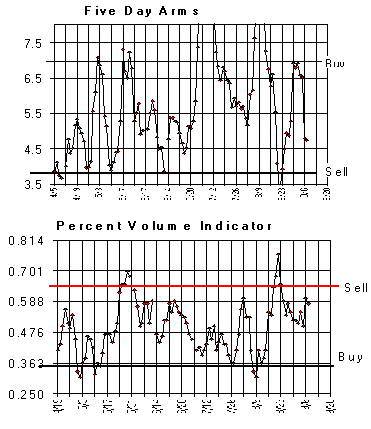
The “Percent Volume”Indicator closed at .58 and in neutral territory.
“Five day ARMS”indicator closed at 4.74 and in neutral territory.
Conclusion: Long SPX on 8/10/04at 1079.04.
Longer Term Trend: Long SPX on8/19/04 at 1091.23.


