*Interview with Ike Iossif on October 14
For 30 to 90 days horizon: Long SPX (10/25/04) at 1094.46.
Long Nasdaq (10/21/04) at1953.62.
What to expect now:
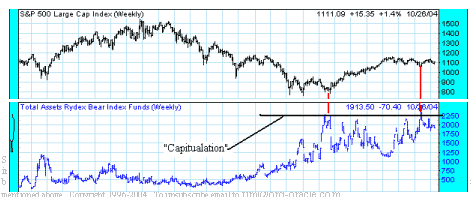
We are long the SPX (at the bottom) on 10/25 at1094.46. A "Sign of Strength" appeared yesterday and today. A"SOS" is a wide price spread and big volume day and these days appear in thetrend direction of the market. Since the "SOS" are appearing now to theupside, it implies that an impulse wave to the upside has began. This rally phase shouldexceed the highs of October, June and March of this year and should surpass the March 2002high of 1175 as well. This rally phase should have very high volume as well as bigprice spread to exceed these previous highs. The reason the current rally shouldhave these attributes is that for a valid "Jump" above the previous highs thevolume has to be huge to confirm the "Jump". Anything less will besuspect. It should be the best rally of the year. We has included a graph ofthe "Rydex bear asset fund" compared to the SPX on the last page of this report(Courtesy of www.decisionpoint.com). We have drawn a horizontal line wherecapitulation has appeared in the past, pacifically at the March 03 lows. You willnotice that the "Rydex assets bear fund" hit this capitulation line in July o3and mid august 04 and that is one of the reasons we turn intermediate term bullish inAugust. You can see what kind of rally materialized from the Mach 03 low whenthe capitulation line was hit. It was a tremendous rally. We are expectingsomething similar on the current rally. Right now we have targets near the 1550level on the S&P. We are long the SPX at 1094.36 on 10/25/04.
Long (9/22/04) NEXM at 1.33. We hold LU at 3.45. Wehold HPC at 13.73. We bought EGHT at 2.62. Eght has support at 2.75 which iswhere a gap formed between 9/16 and 9/17 and is also where the previous high was back inJune, both of which are support zones. Next rally should go to at least 6.00 topossibly 8.00. Long INGP on 10/7 at 5.22.

Nasdaq Composite:
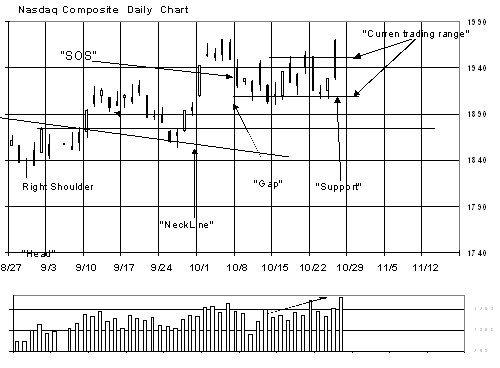
The Nasdaq McClellan Summation index has turned up and implies the trend has turned backup. The Nasdaq McClellan Oscillator was producing a positive divergence over thelast couple weeks when the market was hitting support near the 1900 to 1910 area andsuggested this market is about to turn up. On Monday's report, we said, "LastThursday the Nasdaq hit a minor new high above the October 8, 13 and 19 high near the 1950range on higher volume. When a market hits a new high on higher volume that highwill be eventually exceeded. There can be pullbacks, but the eventually outcome willbe a break to new highs. This condition is very bullish." Today theNasdaq broke above the 1950 area on volume and implies a valid break to the upside. Next minor resistance zone is 2050 area, however, we believe the 2900 area will be seen inthe bigger picture time frame. We are long the Nasdaq from 10/21 close at 1953.62.
GOLD Market:
We like what we said on Monday's commentary and see now reason to change it, "Volumeis increasing on most Gold issues over the last several weeks as this market has movedhigher and a very bullish condition. High volume needs to confirm rising prices andthe XAU has done that. Today's rally came near touching the previous high set backon April 1 at the 106.36 level. Volume on today's rally on the XAU was 33 millionand the April 1 top came on 30 million. Testing previous highs on higher volumeimplies that previous high will be exceeded. We still expect the 150 to 180 rangewill be seen. We are starting to get targets for the high to be reached in March of2005. If things change we will change with it. Whatever the next top will bewhether it is 150 or 180 or something in between, it will mark a top probable for manyyears. But right now the trend is up." Wedouble our positions in BGO on (7/30/04) at 2.34 and we now have an average price at 2.70.Long CBJ for an average of price of 2.89. CBJ is on a monthly buy signal from theMay low. Long NXG average of 2.26. NXG has support at 1.35. NXG is on a buysignal on the monthly chart that was triggered in May. We doubled our position inGSS on (7/30/04) at 4.04 and we have an average price of 5.24. Long PMU ataverage 1.12.
The “Percent Volume” Indicator closed at .60 and in neutral territory.
“Five day ARMS” indicator closed at 4.75 and inbullish territory.
Conclusion: Long SPX at 1094.8 on 10/25/04.
Long Nasdaq 1953.62 on 10/21/04.


