Jump to content


Photo

The Ord Oracle 11/4/4


  • Please log in to reply
No replies to this topic

#1 TTHQ Staff

TTHQ Staff

    www.TTHQ.com

  • Admin
  • 8,597 posts

Posted 04 November 2004 - 09:36 AM


Interview with Ike Iossif on October 28
http://marketv
iews.tv/freeservices/archives1/Guests/Ord/pg1.htm
**Interview with Leo Leydon For November 3 http://financialfocusadvisoryservices.com/radio.html-click archive.
"Timer Digest" has TimOrd ranked #3 in performance for 6 month for the S&P and #6 for 3 months ending10/1/04.
For 30 to 90 days horizon: Long SPX (10/25/04) at1094.46.  Long Nasdaq (10/21/04) at 1953.62.

For monitoring purposes: Long XAU, 87.96 on4/21/04.

Longer Term Trend monitoring purposes: Long SPX on8/19/04 at 1091.23


What to expect now:


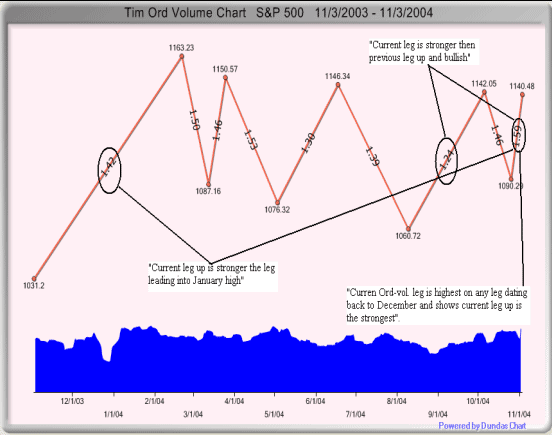
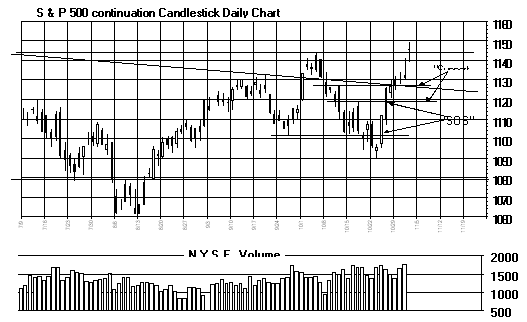
We are long theSPX (at the bottom) on 10/25 at 1094.46.  A"Sign of Strength" appeared on 10/26 and 10/27 and confirmed the uptrend.  A "SOS" is a wide price spread and bigvolume day and these days appear in the trend direction of the market.  Today the S&P gap up strongly on high volumeand created a candlestick pattern called a  "Doji"on the Close .  "Doji" with highvolume imply a break to new highs will occur after a pull back is completed.  Light volume "Doji" is bearish andimplies a top.  What this high volume"Doji" may imply is a pullback to fill today's gap before heading higher.  The NYSE McClellan Summation is trending up andimplies the trend is up and therefore only a short-term pull back is implied.  On the bigger time frames, we should see a robustrally through the highs of June, April and March.  Weexpect volume to increase as this rally progress higher and so far that has been the case.  Support lies near the 1127 level, which is the10/13 high.  The bigger trend is up to the endof the year if not longer.  We have included agraph in the format of "Ord-Volume", which shows the current leg up from theOctober low is the strongest leg dating back to December 03.  This condition implies the current leg up has themost power and should break out to the upside.

 To learn more on "Ord-Volume" please visit www.ord-oracle.com.  

Long (9/22/04)  NEXM at 1.33. We hold LU at 3.45. We hold HPC at13.73.  We bought EGHT at 2.62.  Eght traded below support yesterday and thengapped up strongly today back above support and created a high volume "Doji".  Doji pattern after a gap up from a bottom is verybullish.  There can be an attempt to filltoday's gap before heading higher, as long as volume is lighter on the attempt the picturewill remain bullish. Next rally shouldgo to at least 6.00 to possibly 8.00. Long INGP on 10/7 at 5.22.


Nasdaq Composite:

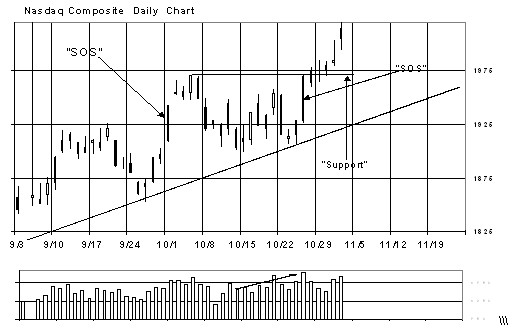
The volume on the Nasdaq increased todayas it hit a new short term high and a bullish sign.  TheNasdaq may attempt to pull back to support before heading higher. Support comes 1970 downto the 1950 level, which are the previous highs.  TheNasdaq jumped the 1950 highs with a "Sign of Strength" and implies any pull backto the 1950 area should hold.  Therefore thereis not much downside from current levels.  Nextminor resistance zone is 2050 area, however, we believe the 2900 area will be seen in thebigger picture time frame.  We are long theNasdaq from 10/21 close at 1953.62. 

GOLD Market:


The XAU hit a highon October 25 at the 106 range on volume of 33 million shares.  The October 25 volume day had  higher volume then the previous high set on October8 (high came in at 105) and the April 1 high (106.36). When a market pushes against a previous high on higher volume then that high willeventually be broken.  Therefore the biggerpicture remains bullish.  Near term there maybe a pull back to test the previous low set on 10/14 near the 96 level before the 106 areais exceeded.

We double ourpositions in BGO on (7/30/04) at 2.34 and we now have an average price at 2.70. Long CBJfor an average of price of 2.89.  CBJ is on amonthly buy signal from the May low.  Long NXGaverage of 2.26. NXG has support at 1.35.  NXGis on a buy signal on the monthly chart that was triggered in May.  We doubled our position in GSS on  (7/30/04) at 4.04 and we have an average price of5.24.  Long PMU at average 1.12.
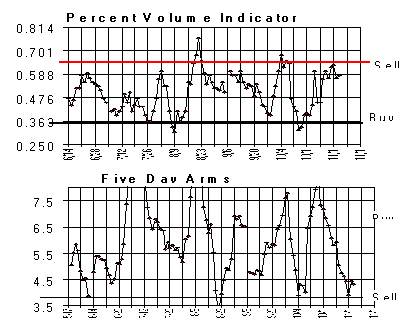


The McClellanOscillator closed today's at +113 and overbought.
The “Percent Volume” Indicator closed at .58 and neutral.
“Five day ARMS” indicator closed at 4.32 and in neutral territory.
Conclusion: Long SPX at 1094.8 on 10/25/04.  LongNasdaq 1953.62 on 10/21/04.
Longer Term Trend: Long SPX on 8/19/04 at 1091.23.