*Interview with Ike Iossif on October 28
**Interview with Leo Leydon For November 10
"Timer Digest" has Tim Ord ranked #3 in performance for 6month for the S&P and #6 for 3 months ending 10/1/04.
For 30 to 90 days horizon:Long SPX (10/25/04) at 1094.46.
Long Nasdaq (10/21/04) at 953.62.
For monitoring purposes: Long XAU, 87.96 on 4/21/04.
Longer Term Trend monitoring purposes: Long SPX on 8/19/04 at 1091.23
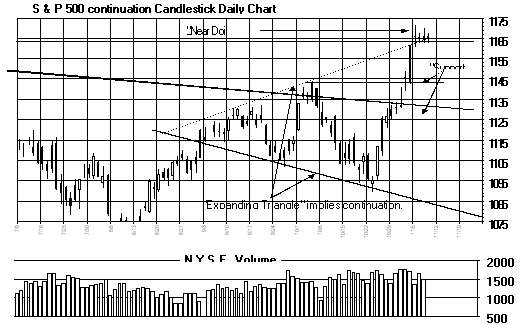
What to expect now:On Monday's commentary, we said, "The S&P has drawn an "ExpandingTriangle" pattern, which is a continuation pattern on the bigger time frames. The short-term time frames suggest a pullback may start near current levels and retraceback down to support. Support comes in at the previous high near the 1145 level. The next support below that comes in near 1127. This potential pullback maygo into expiration week, which is next week." We see no reason to change thisprediction for the moment.
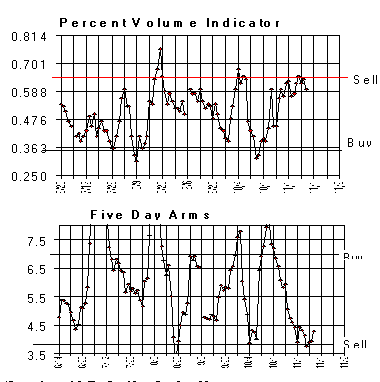
The "Percent Volume" indicator closed the last four days near .64 and in bearishterritory. The "5 day ARMS" has closed below for 4.00 for the lastseveral days also and in bearish territory. The S&P also have beendrawing near bearish "Doji" patterns for the last couple of days and suggest themomentum to the upside is waning. Therefore, watch for a pullback near term thatmay last into expiration week. Once this potential pullback is completed intoexpiration week, we expect the rally on the bigger time to reemerge and carry the markethigher into year-end if not longer. We are long the SPX that was bought on 10/25/04at 1094.23.
To learn more on "Ord-Volume" please visit www.ord-oracle.com.
Long (9/22/04) NEXM at 1.33. We hold LU at 3.45. We hold HPC at 13.73. Webought EGHT at 2.62. Next rally should go to at least 6.00 to possibly 8.00. LongINGP on 10/7 at 5.22.
Nasdaq Composite:
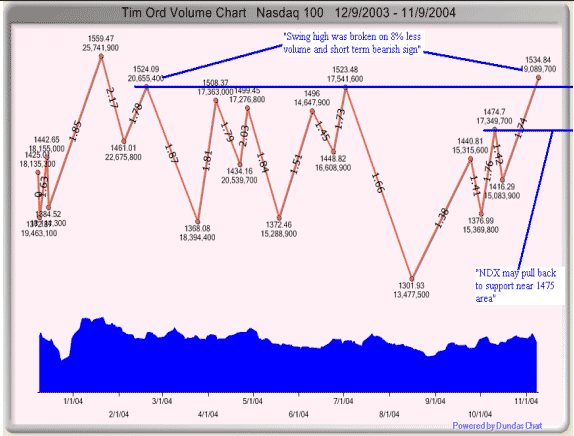
We have included an "Ord-Volume" graph of the NDX. This graph was also onMonday's report and we kept it because little has changed and the conditions are stillintact for a potential pullback into expiration week. Notice the current rallytested February high near the 1524.09 level on 8% lighter volume and suggest a false breakto the upside. This condition suggest a pullback down to the first support areanear the 1470 range. Since current "Ord-Volume" leg up is higher then theprevious "Ord-Volume" leg down (Going into the August low, 1.66), there is moreforce on the current upleg and suggest the next pull back should be bought. The biggertrends are up and we are holding our position. We are long the Nasdaq from 10/21close at 1953.62.
GOLD Market:
The XAU has produced bullish volume and price action since the May 10 low. Mostintermediate term indictors we follow are not anywhere near overbought or near bearishterritory and therefore we expect the uptrend to continue. Support comes in at thegap level that was produce between November 3 and 4 near the 103 level. The biggertime frames suggest the XAU should head to the 150 to 180 ranges.
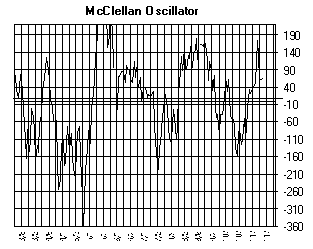
The McClellan Oscillator closed today's at +68 and neutral.
The “Percent Volume” Indicator closed at .60 and overbought.
“Five day ARMS” indicator closed at 4.30 and in bearish territory.
Conclusion: Long SPX at 1094.8 on 10/25/04.
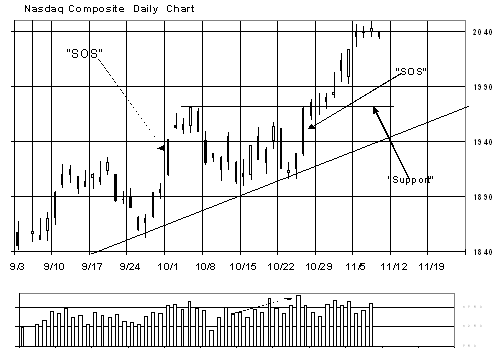
Long Nasdaq 1953.62 on 10/21/04.
Longer Term Trend: Long SPX on 8/19/04 at 1091.23.
